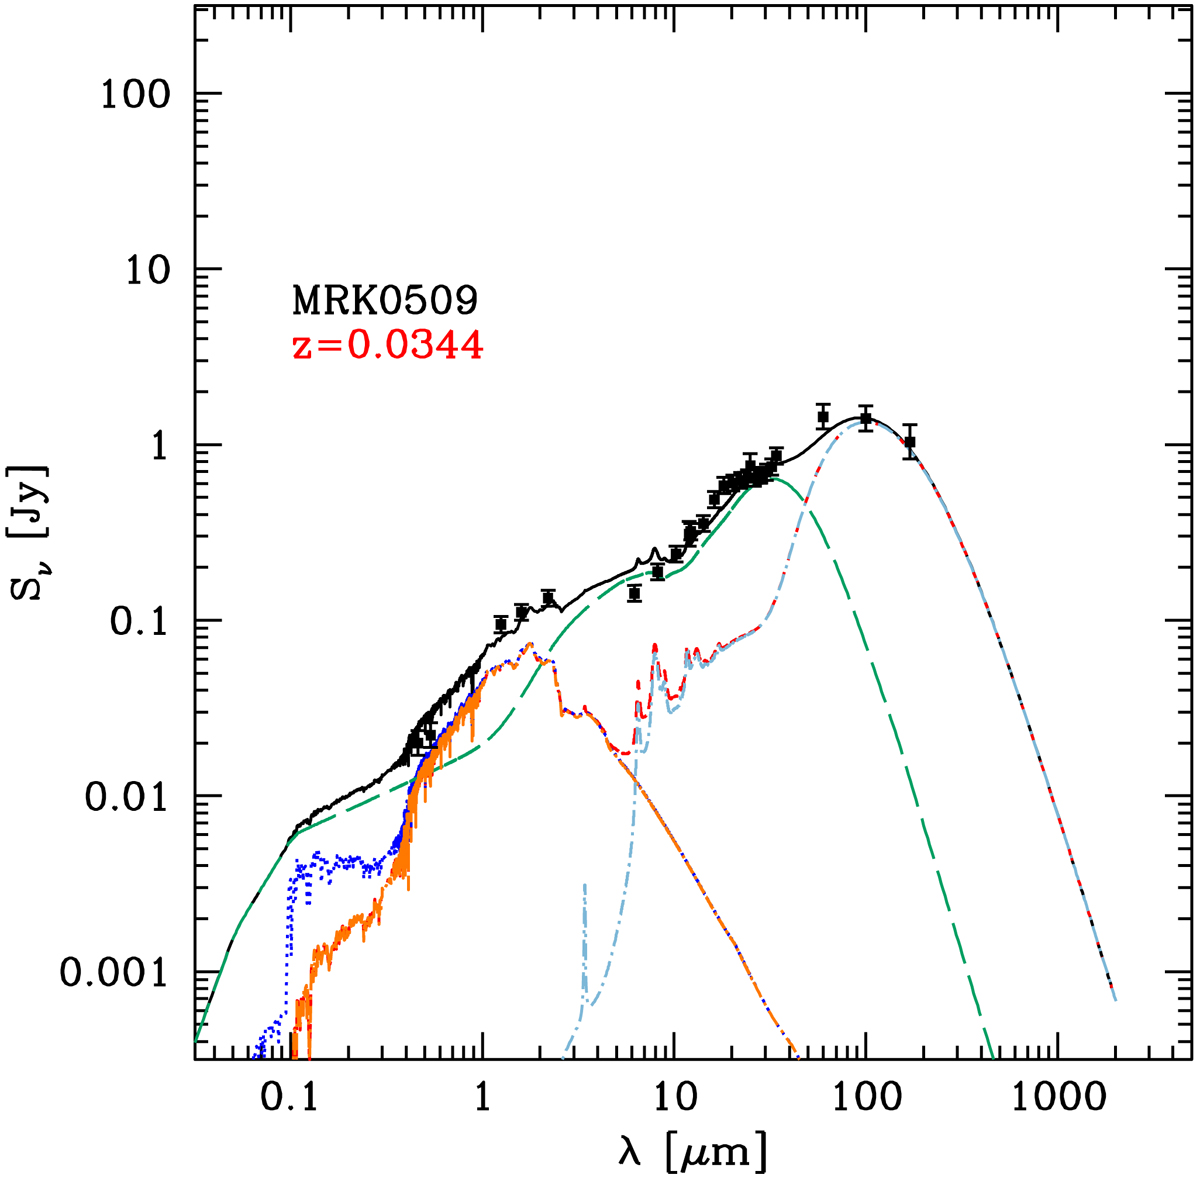
Fig. A.1.
Download original image
Mrk509 observed SED decomposed into stellar, AGN, and SF components using the technique described by Gruppioni et al. (2016). The black filled circles with error bars are data, the blue dotted lines show the unabsorbed stellar component, the red dashed lines show the combination of extinguished stars and dust IR emission, while the long-dashed green lines show the dusty torus emission. The pale blue dot-dashed lines show the dust re-emission, while the black solid lines are the sum of all the components (total emission).
Current usage metrics show cumulative count of Article Views (full-text article views including HTML views, PDF and ePub downloads, according to the available data) and Abstracts Views on Vision4Press platform.
Data correspond to usage on the plateform after 2015. The current usage metrics is available 48-96 hours after online publication and is updated daily on week days.
Initial download of the metrics may take a while.