Fig. 1.
Download original image
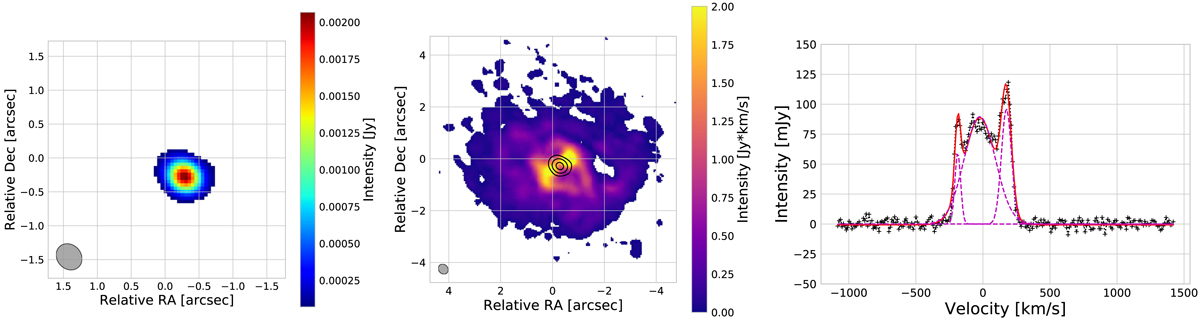
Continuum emission, CO(2−1) integrated flux maps of Mrk 509 and the CO(2−1) spectrum extracted from the continuum-subtracted clean data cube. Left panel: 1.2 mm continuum map of Mrk 509. Regions with emission below 5σ have been blanked. The synthesised beam (0.396 × 0.343 arcsec2) is shown by the grey filled ellipse. Central panel: CO(2−1) integrated flux map, where a mask with threshold of 3σ has been applied. Black contours show the 1.2 mm continuum emission at (5, 30, 100) × σ. The synthesised beam is shown in the bottom left corner. Right panel: CO(2−1) spectrum (black crosses) extracted from the continuum-subtracted clean data cube from the regions where emission is above 3σ. The solid red line shows the multi-Gaussian fit; the magenta lines show the three Gaussian components.
Current usage metrics show cumulative count of Article Views (full-text article views including HTML views, PDF and ePub downloads, according to the available data) and Abstracts Views on Vision4Press platform.
Data correspond to usage on the plateform after 2015. The current usage metrics is available 48-96 hours after online publication and is updated daily on week days.
Initial download of the metrics may take a while.