Free Access
Fig. 6
Download original image
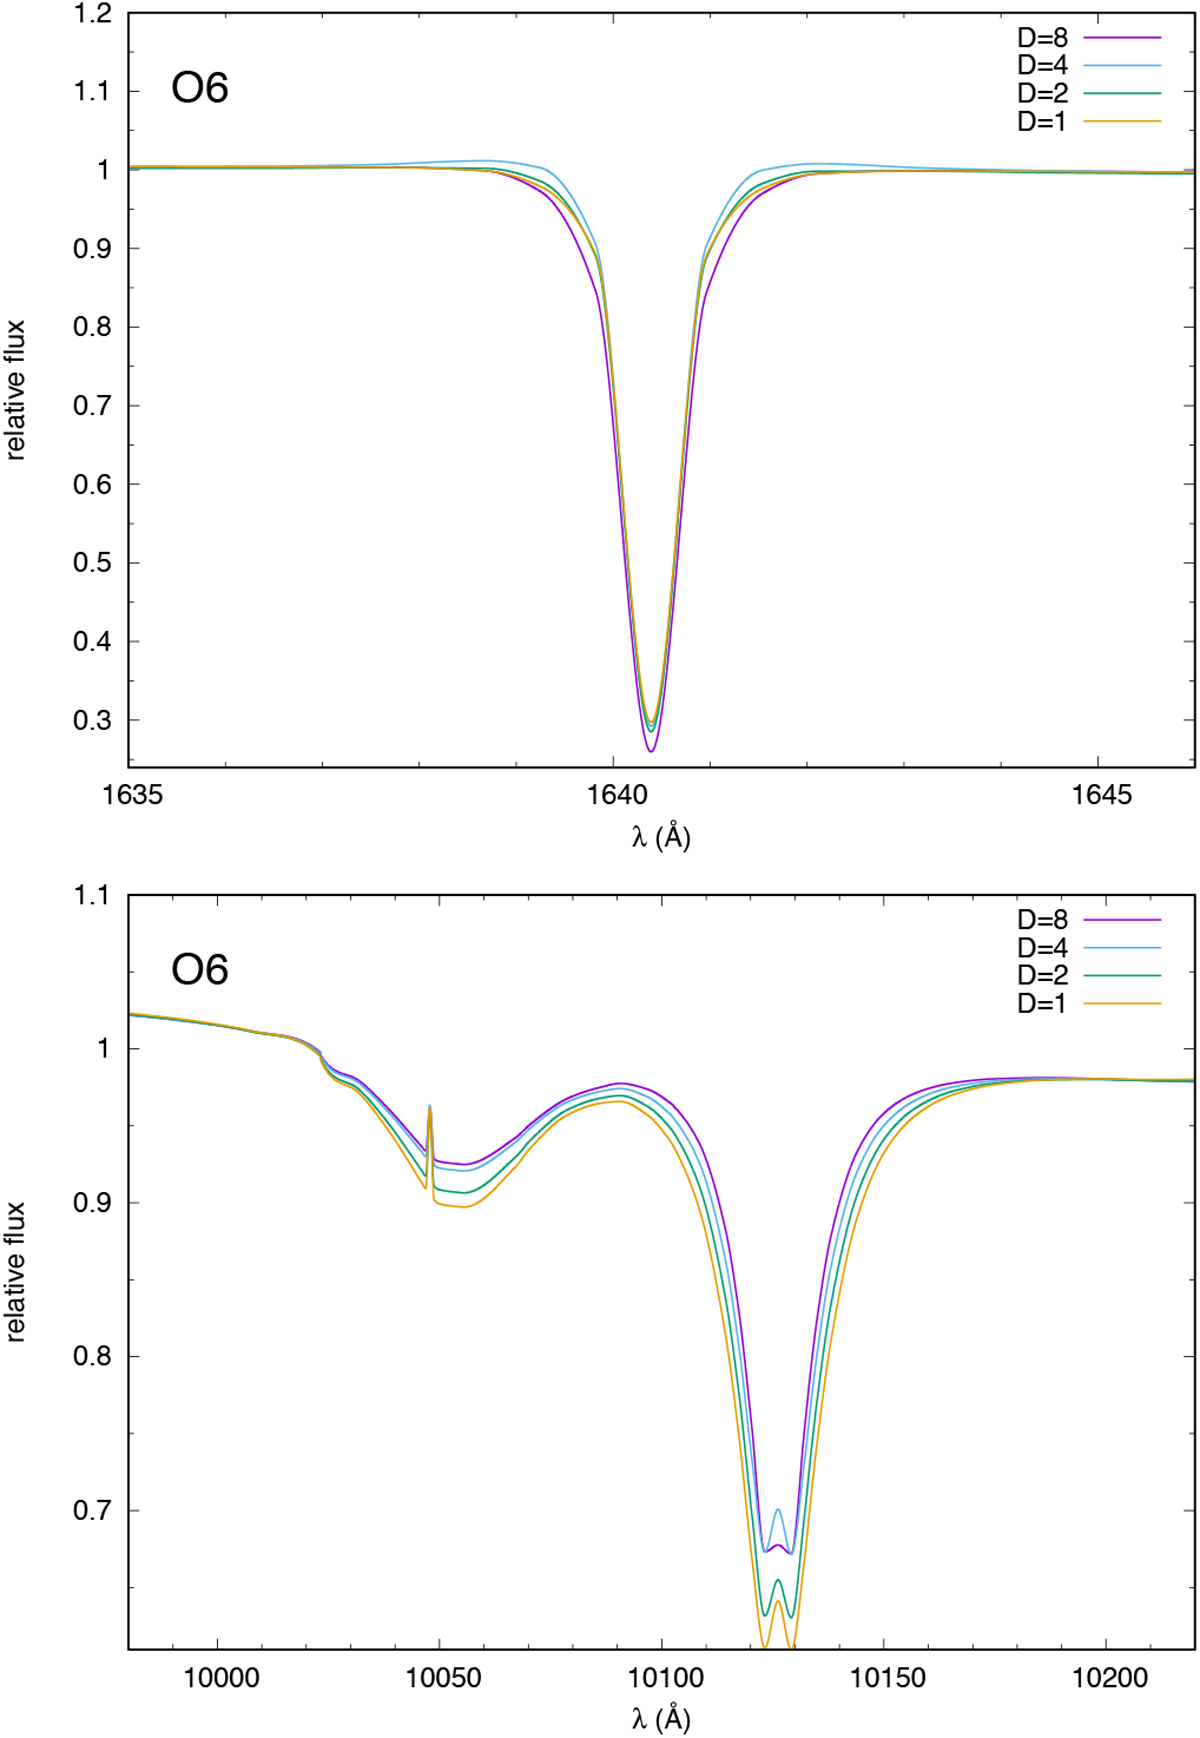
Selected normalised line profiles for the O6 model for clumping factors D = 1, 2, 4, 8. Upper panel:He II Hα line profile. Lower panel: He II Piα (4–6, 10 123 Å) and H I Pδ line with an emission peak of the He II 6–14 line (10 048 Å) line profiles.
Current usage metrics show cumulative count of Article Views (full-text article views including HTML views, PDF and ePub downloads, according to the available data) and Abstracts Views on Vision4Press platform.
Data correspond to usage on the plateform after 2015. The current usage metrics is available 48-96 hours after online publication and is updated daily on week days.
Initial download of the metrics may take a while.