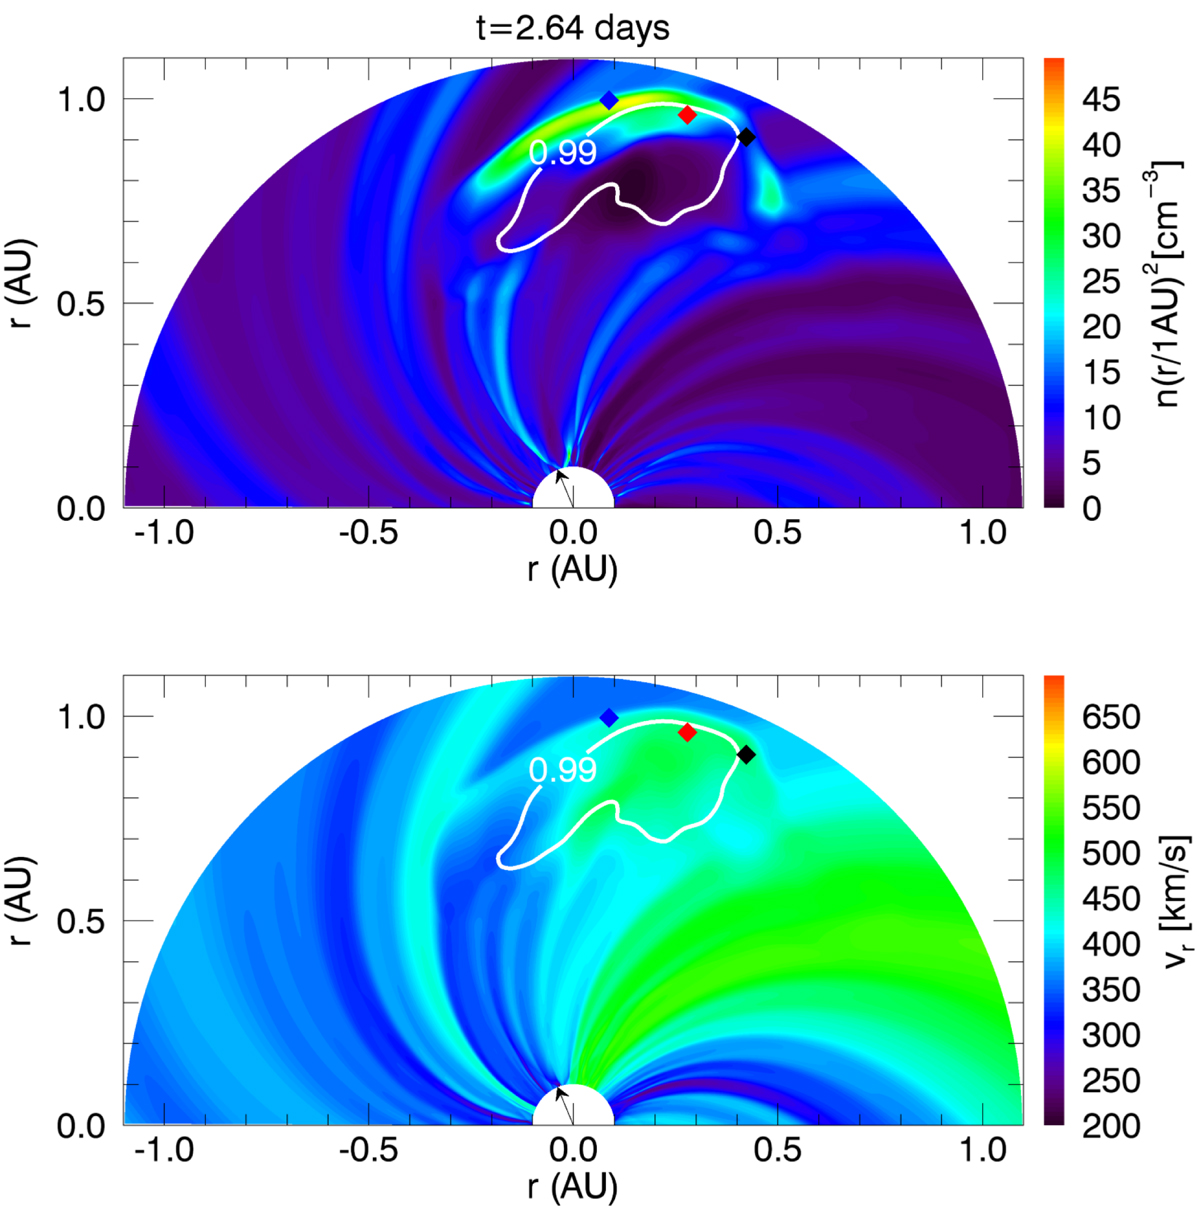
Fig. 1.
Download original image
Contour (99%) of the ICME tracer mass (white) on colour maps of plasma number density and radial velocity at the labelled time of the MHD simulation (see text for details). The coloured diamonds (φ = 85°, 73.8°, 65°) show the position of three virtual spacecrafts, which would detect the time profiles in Fig. 2. The black arrow indicates the entry point of the ICME into the inner boundary. See online animation.
Current usage metrics show cumulative count of Article Views (full-text article views including HTML views, PDF and ePub downloads, according to the available data) and Abstracts Views on Vision4Press platform.
Data correspond to usage on the plateform after 2015. The current usage metrics is available 48-96 hours after online publication and is updated daily on week days.
Initial download of the metrics may take a while.