Fig. 6.
Download original image
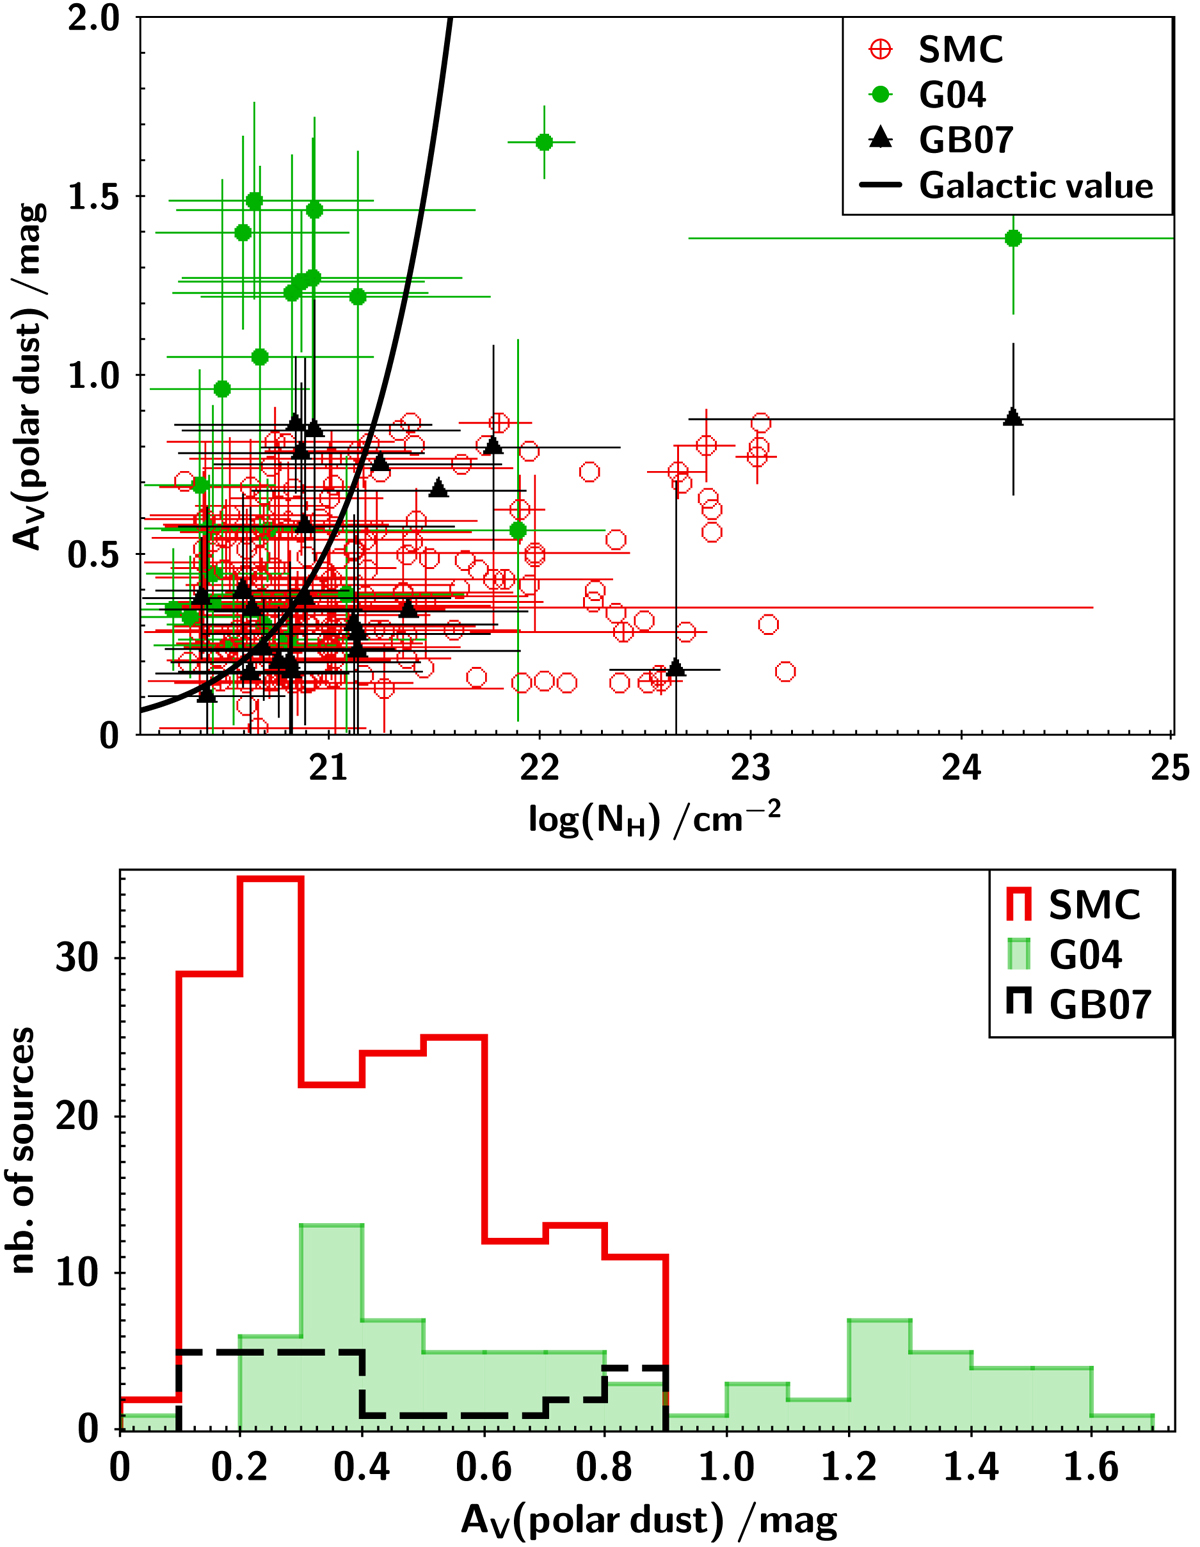
V-band attenuation AV due to the AGN polar dust component. Top panel: AV is plotted against the X-ray absorbing column density NH for sources with polar dust described either with the SMC law (red circles) or the G04 law (green points). AV is also plotted for the 24 sources that are found to be consistent with the GB07 law (black triangles). Uncertainties on AV measurements (1σ dispersion estimated by X-CIGALE) and NH (16th and 84th percentiles of the distribution) are over-plotted (for only one source with SMC law randomly selected over 3). The Galactic value of AV/NH is indicated as a black line. Bottom panel: AV distribution for sources described with each law.
Current usage metrics show cumulative count of Article Views (full-text article views including HTML views, PDF and ePub downloads, according to the available data) and Abstracts Views on Vision4Press platform.
Data correspond to usage on the plateform after 2015. The current usage metrics is available 48-96 hours after online publication and is updated daily on week days.
Initial download of the metrics may take a while.