Fig. 5.
Download original image
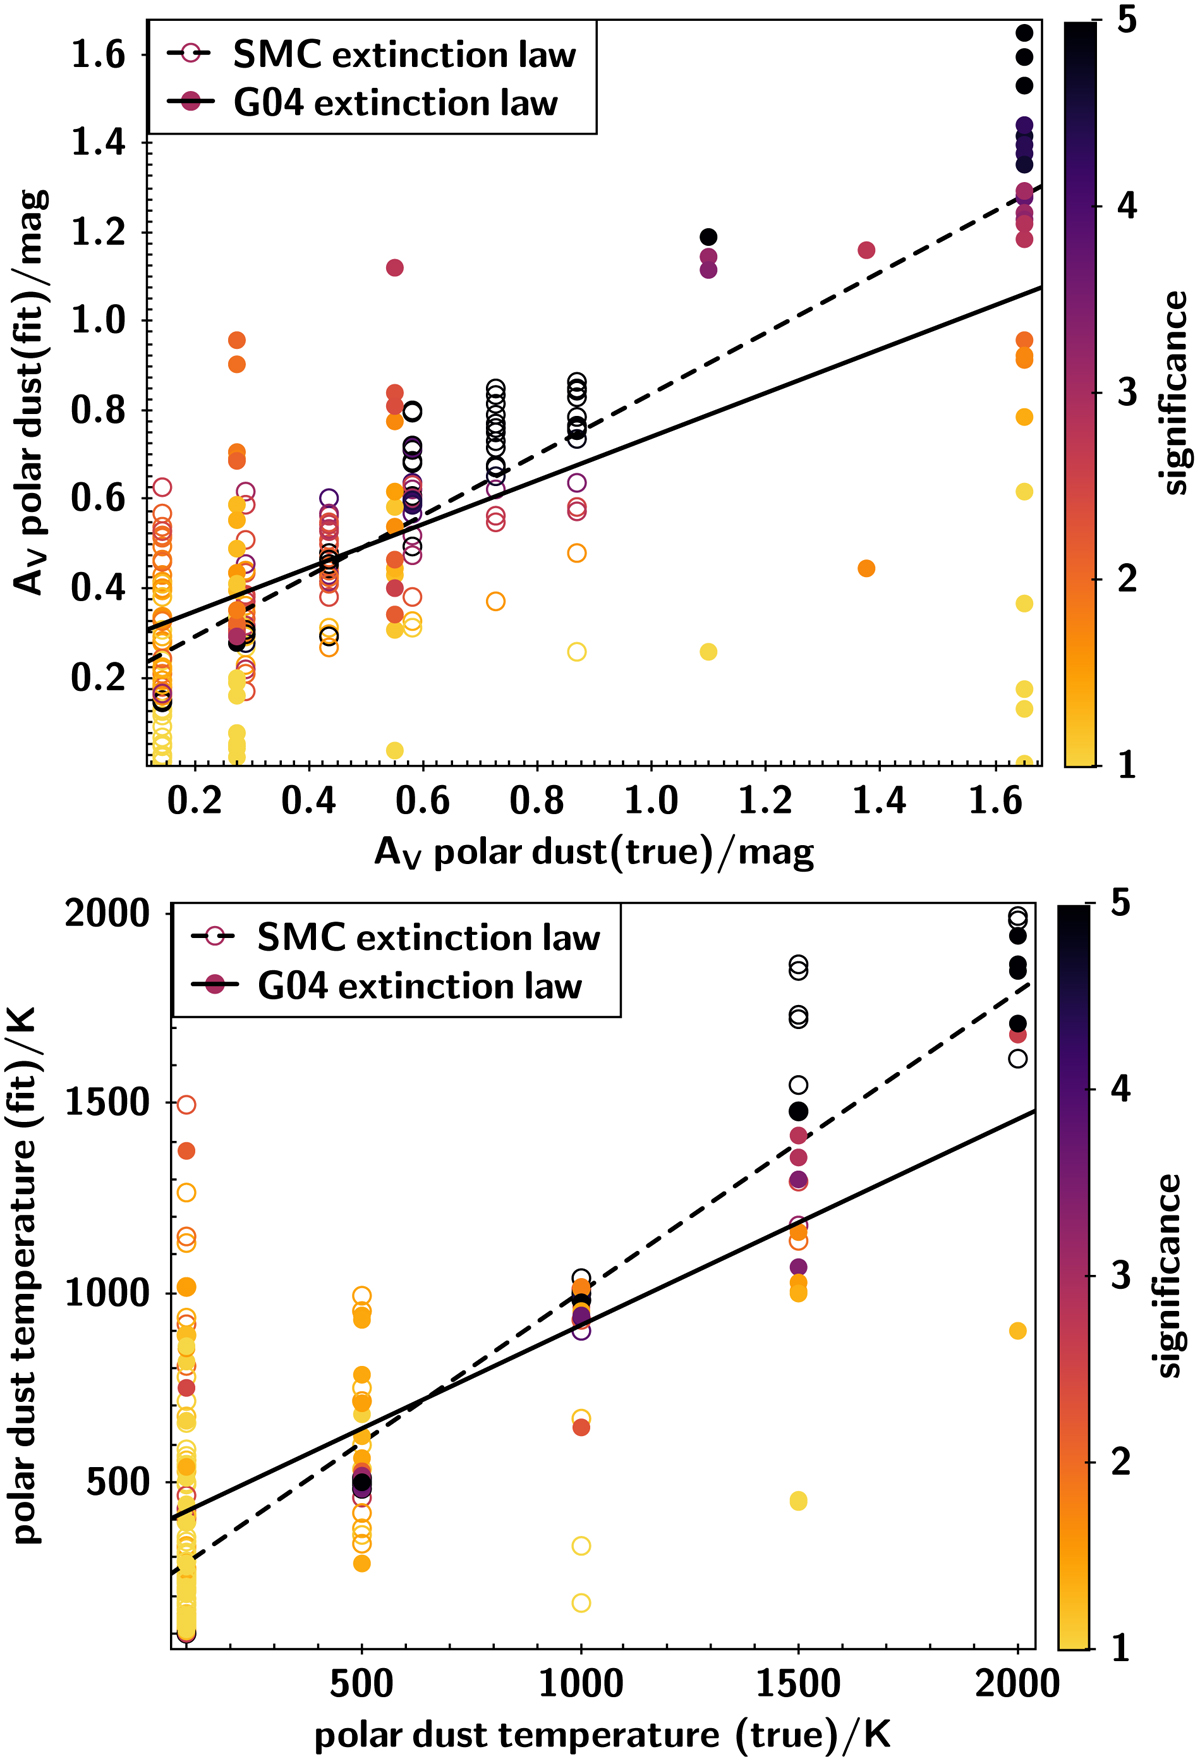
Results of the mock analysis performed for polar dust extinction in the V-band, AV (top panel) and polar dust temperature (bottom panel). The exact values (x-axis) are plotted against the values measured by fitting the simulated datasets (y-axis). The open circles refer to the SMC extinction curve, the filled circles to the G04 extinction curve. The linear fits are shown as solid (G04) and dotted (SMC) lines. The statistical significance of the measure is color-coded.
Current usage metrics show cumulative count of Article Views (full-text article views including HTML views, PDF and ePub downloads, according to the available data) and Abstracts Views on Vision4Press platform.
Data correspond to usage on the plateform after 2015. The current usage metrics is available 48-96 hours after online publication and is updated daily on week days.
Initial download of the metrics may take a while.