Fig. 4.
Download original image
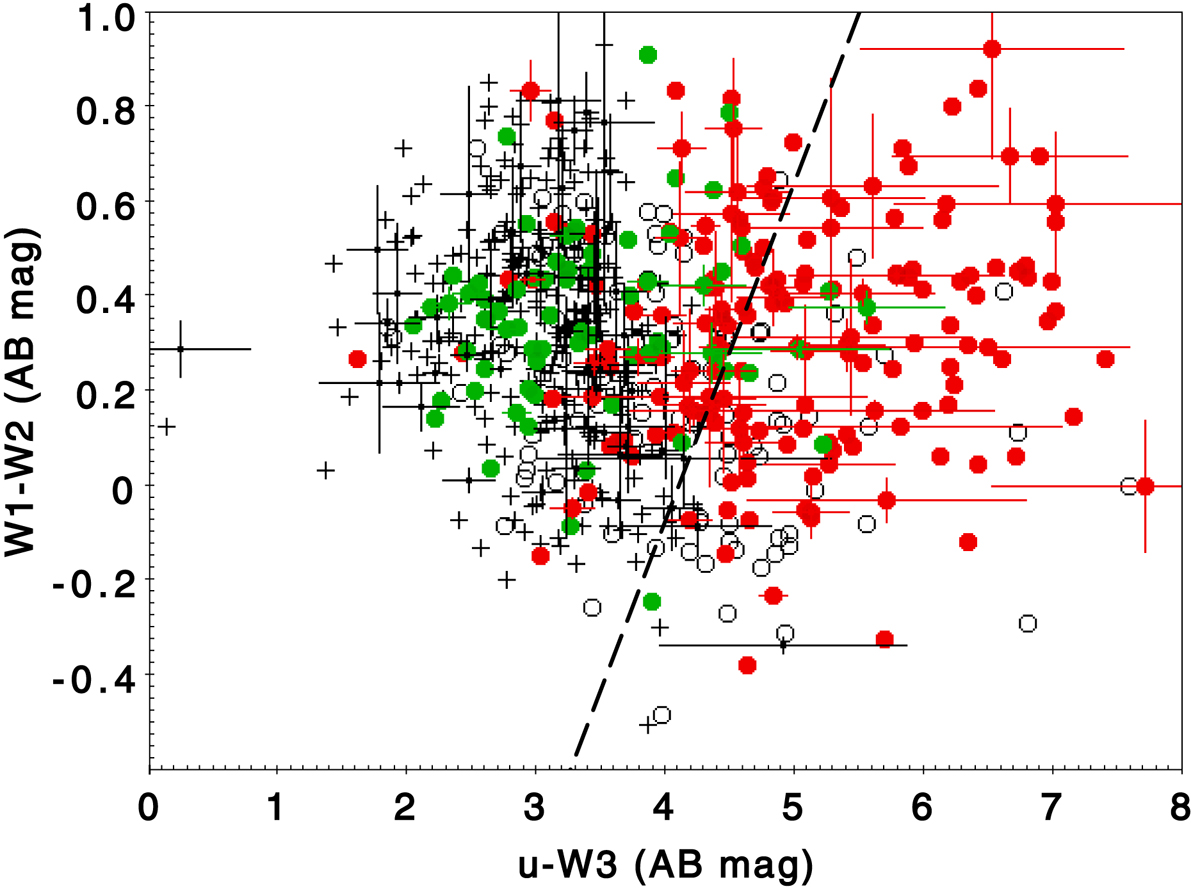
Distribution of our BLAGN sample in the same color plot as in Fig. 2. Sources for which a polar dust component is not needed are represented with crosses, sources better fitted with a polar dust component are plotted with circles. Green circles are for sources better fitted with a G04 extinction curve, red circles for sources better fitted with an SMC extinction curve, open circles sources for which the extinction curve cannot be determined. Sources populating the upper right side of the plot are predominantly found with a polar dust characterized by the SMC extinction curve, the reddening of the u − W3 color is strongly reduced with the G04 extinction curve. Magnitudes are in AB units and the dotted line represents the boundary defined by Hickox et al. (2017) and modified accordingly (u − W3 = 1.4(W1 − W2) + 4.1). Uncertainties in the measured colors are over-plotted for one source randomly selected over five to avoid crowding.
Current usage metrics show cumulative count of Article Views (full-text article views including HTML views, PDF and ePub downloads, according to the available data) and Abstracts Views on Vision4Press platform.
Data correspond to usage on the plateform after 2015. The current usage metrics is available 48-96 hours after online publication and is updated daily on week days.
Initial download of the metrics may take a while.