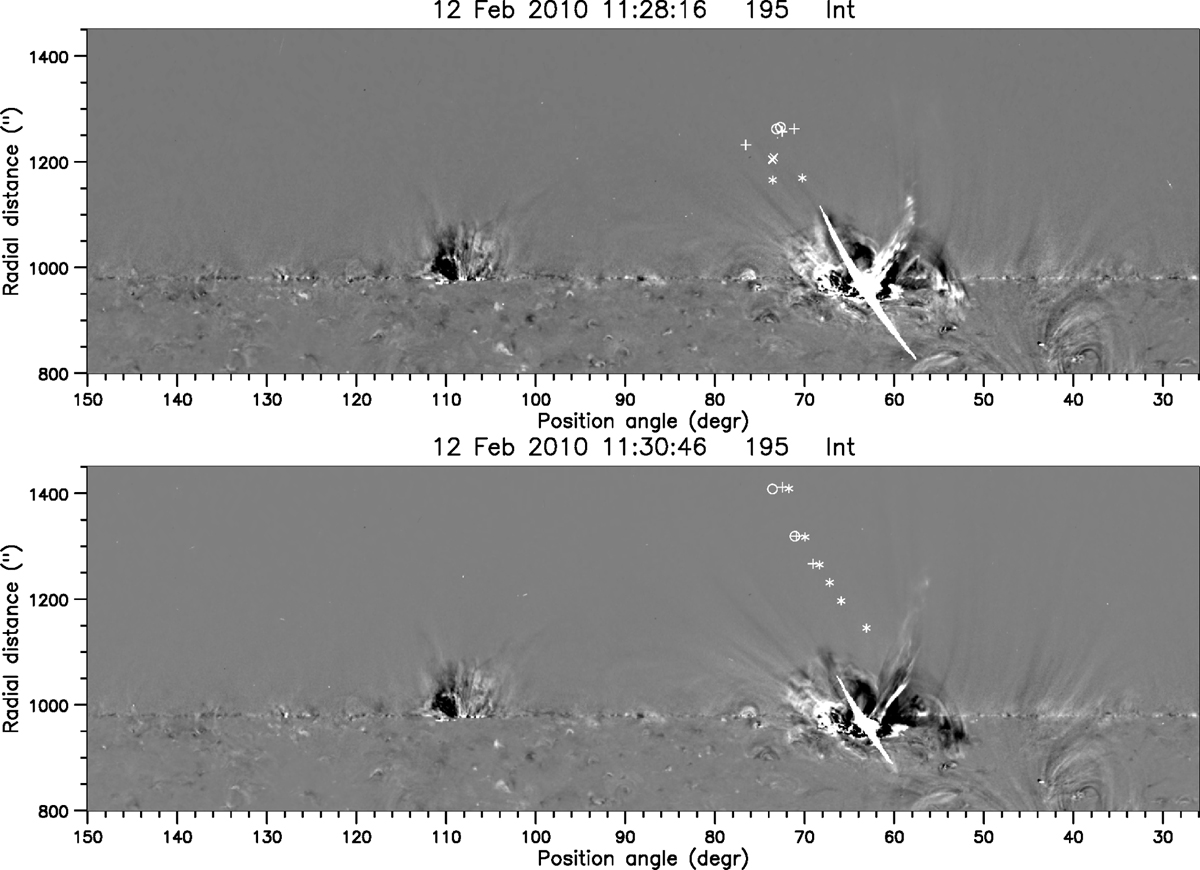
Fig. 8.
Download original image
Projected positions of the type-II radio sources, on top of polar projections of running difference images from 195 Å STEREO-A. Top: type-II during the first phase of the event (11:27:00−11:28:05 UT); asterisks show the average positions from 360.8 MHz, “x” from 298.7 MHz, crosses from 298.7 MHz and open circles from 150.9 MHz. Bottom: type-II during the second phase of the event (11:29:21−11:30:57 UT); asterisks are for branch A, crosses for branch B1 and open circles for branch B2.
Current usage metrics show cumulative count of Article Views (full-text article views including HTML views, PDF and ePub downloads, according to the available data) and Abstracts Views on Vision4Press platform.
Data correspond to usage on the plateform after 2015. The current usage metrics is available 48-96 hours after online publication and is updated daily on week days.
Initial download of the metrics may take a while.