Fig. 7.
Download original image
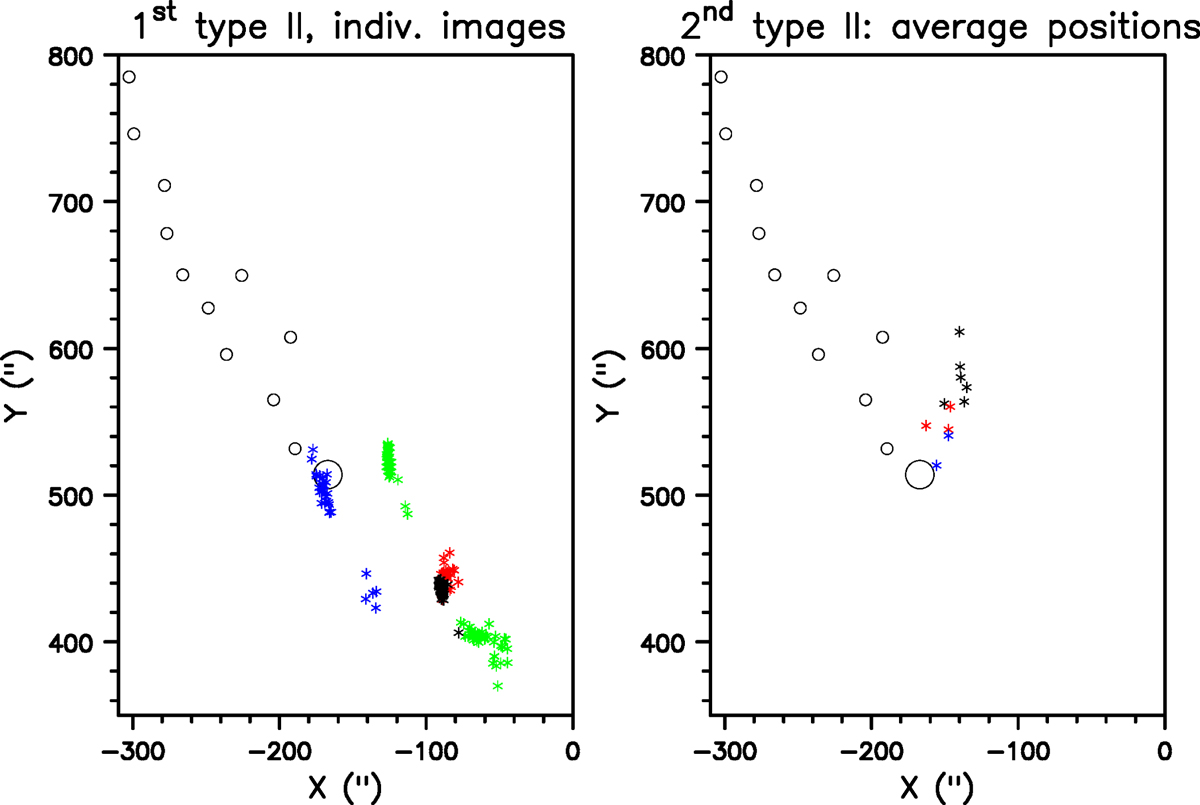
Position of the type-II sources, together with the projected position of the surge (open circles) and the position of the Hα/SXR flare (large open circle). Left: first type-II, individual images; black is for 360.0 MHz, red for 327.0 MHz, green for 297.8 MHz and blue for 150.9 MHz. Right: average images for branches A (black), B1 (red) and B2 (blue) of the second type-II burst.
Current usage metrics show cumulative count of Article Views (full-text article views including HTML views, PDF and ePub downloads, according to the available data) and Abstracts Views on Vision4Press platform.
Data correspond to usage on the plateform after 2015. The current usage metrics is available 48-96 hours after online publication and is updated daily on week days.
Initial download of the metrics may take a while.