Free Access
Fig. 6.
Download original image
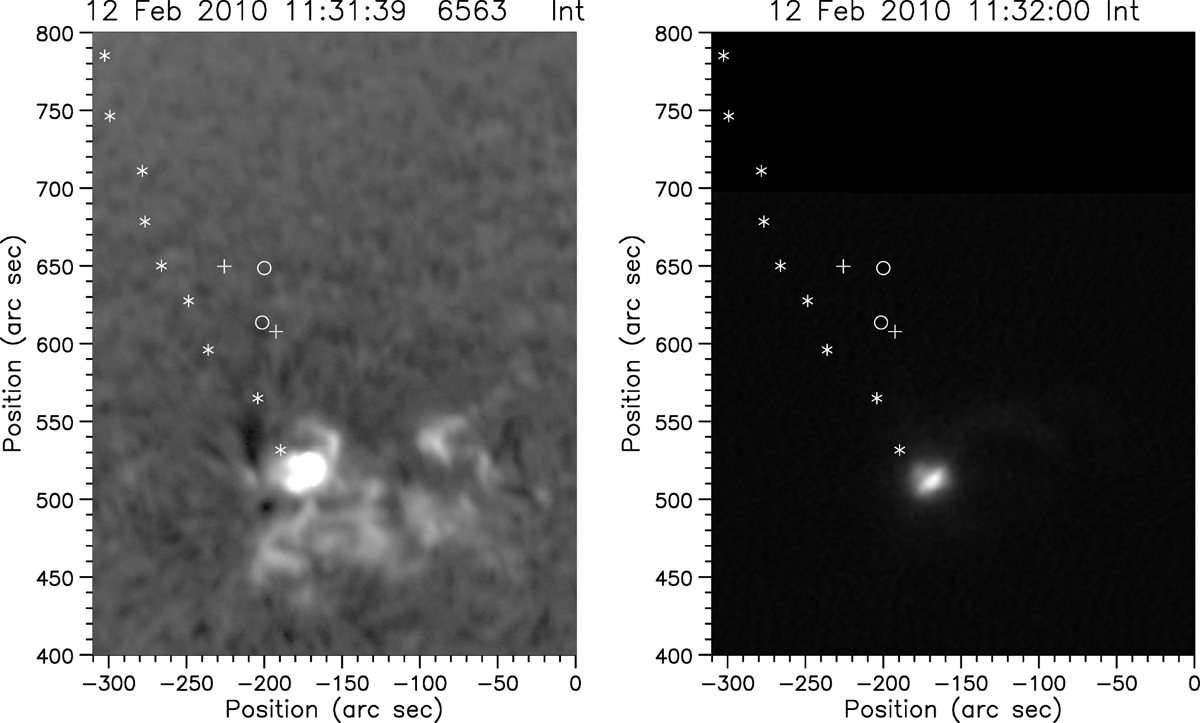
Projection of the surge on the sky plane as seen from the Earth (symbols), on top of an Hα image (left) and an XRT image (right). Different symbols refer to different parts of the surge, giving an idea of its lateral extent.
Current usage metrics show cumulative count of Article Views (full-text article views including HTML views, PDF and ePub downloads, according to the available data) and Abstracts Views on Vision4Press platform.
Data correspond to usage on the plateform after 2015. The current usage metrics is available 48-96 hours after online publication and is updated daily on week days.
Initial download of the metrics may take a while.