Fig. 5.
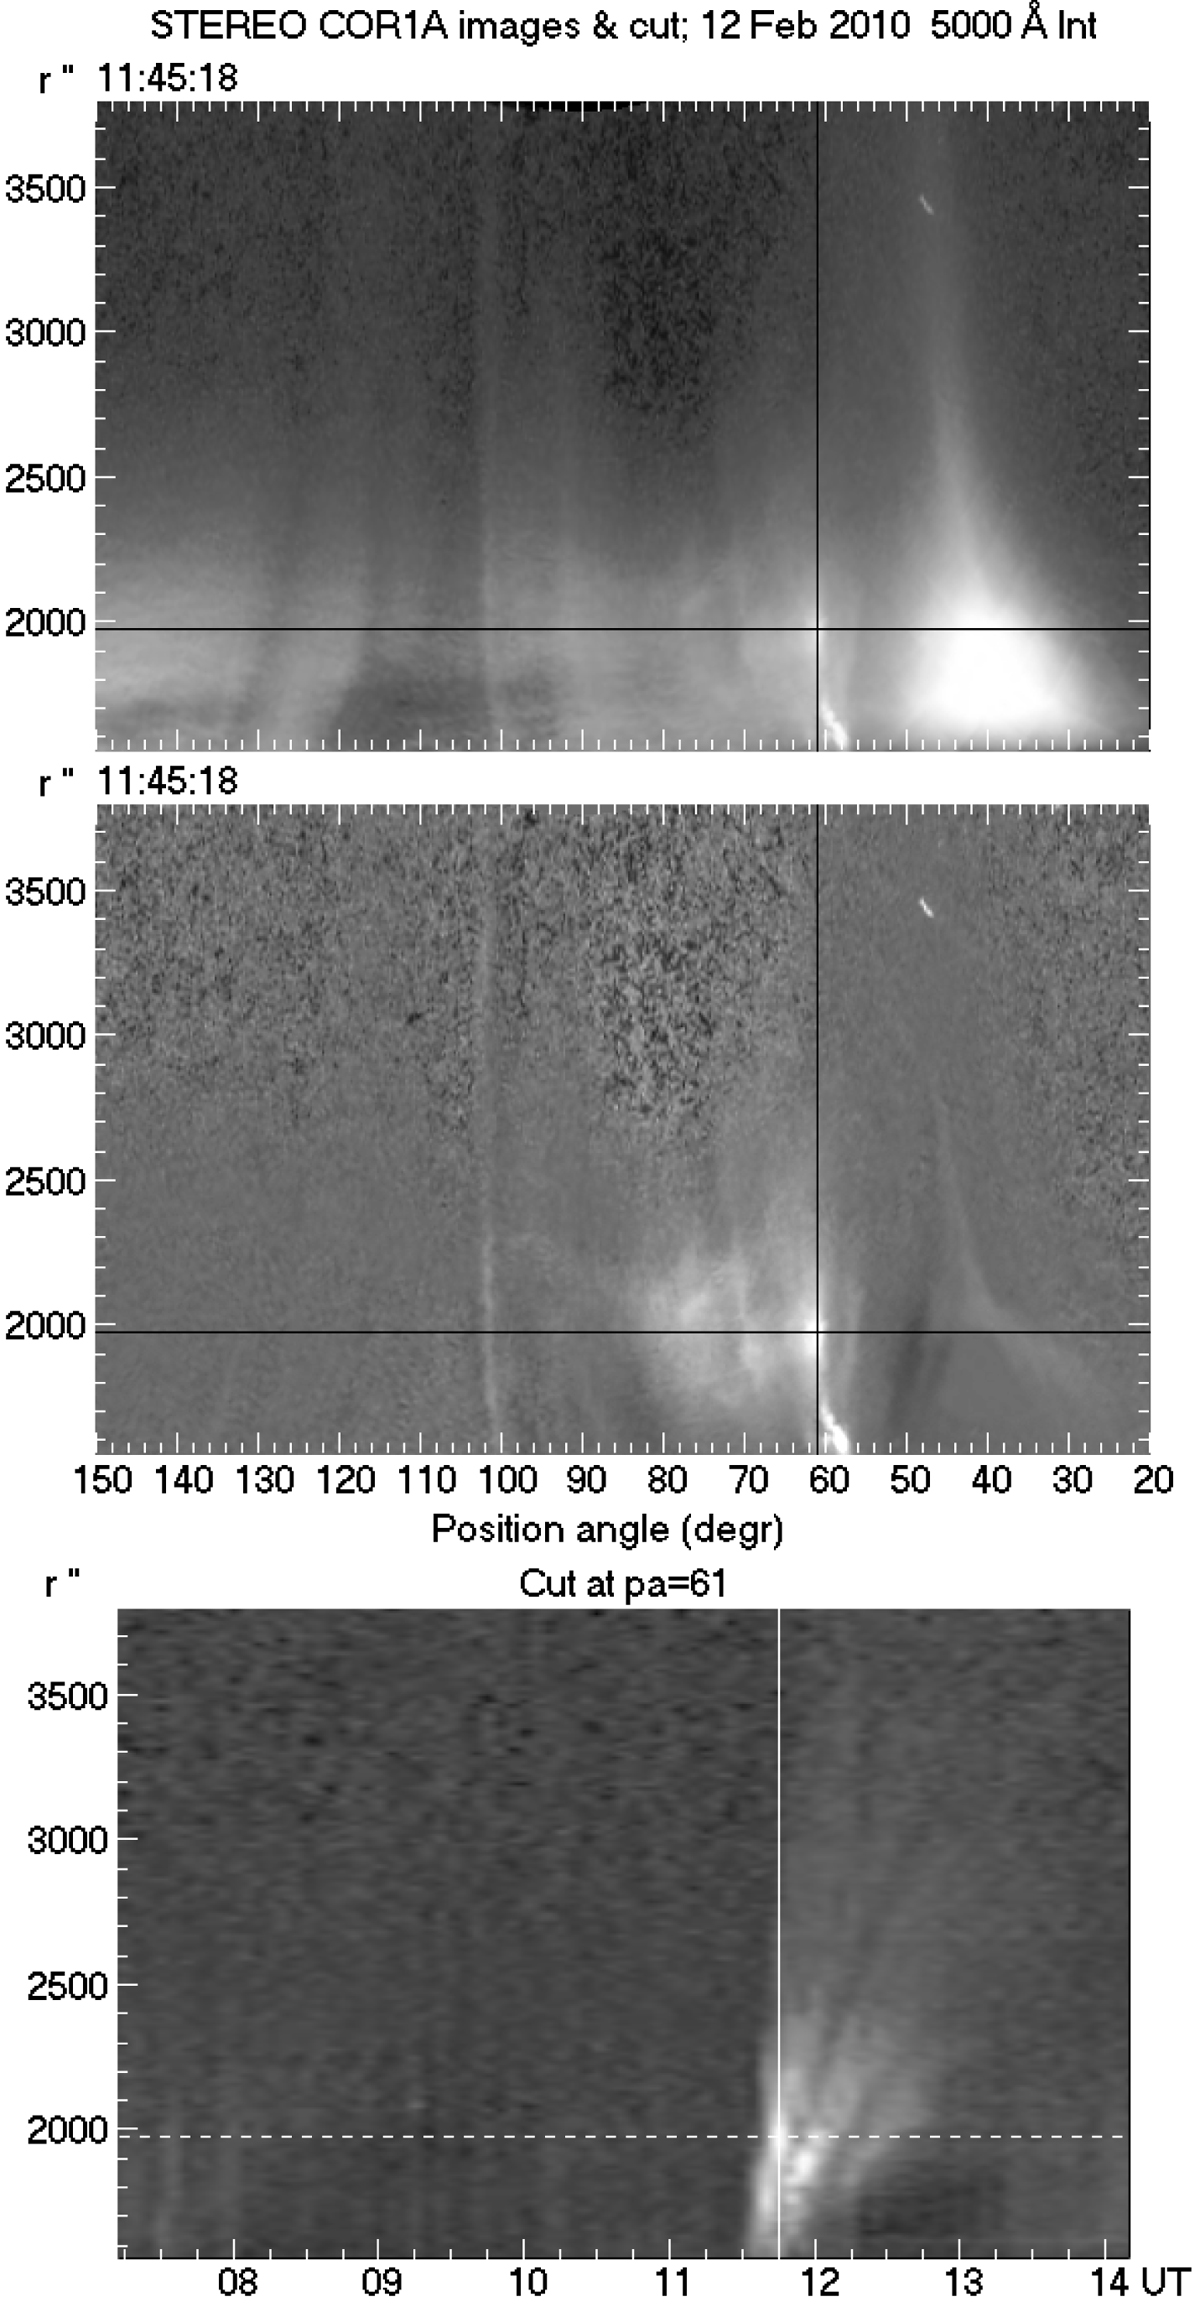
Download original image
Coronagraph observations. Top: COR1A intensity as a function of position angle and distance from the center of the disk, r. Middle: same as top, with the pre-CME intensity subtracted. Bottom: cut of intensity as a function of time and r at a position angle of 61°. Horizontal lines are at the same r in all panels. Vertical lines in the top and middle panel mark the position angle of the cut. Bottom panel: vertical line marks the time of the other panels. The photospheric limb is at r = 972″.
Current usage metrics show cumulative count of Article Views (full-text article views including HTML views, PDF and ePub downloads, according to the available data) and Abstracts Views on Vision4Press platform.
Data correspond to usage on the plateform after 2015. The current usage metrics is available 48-96 hours after online publication and is updated daily on week days.
Initial download of the metrics may take a while.