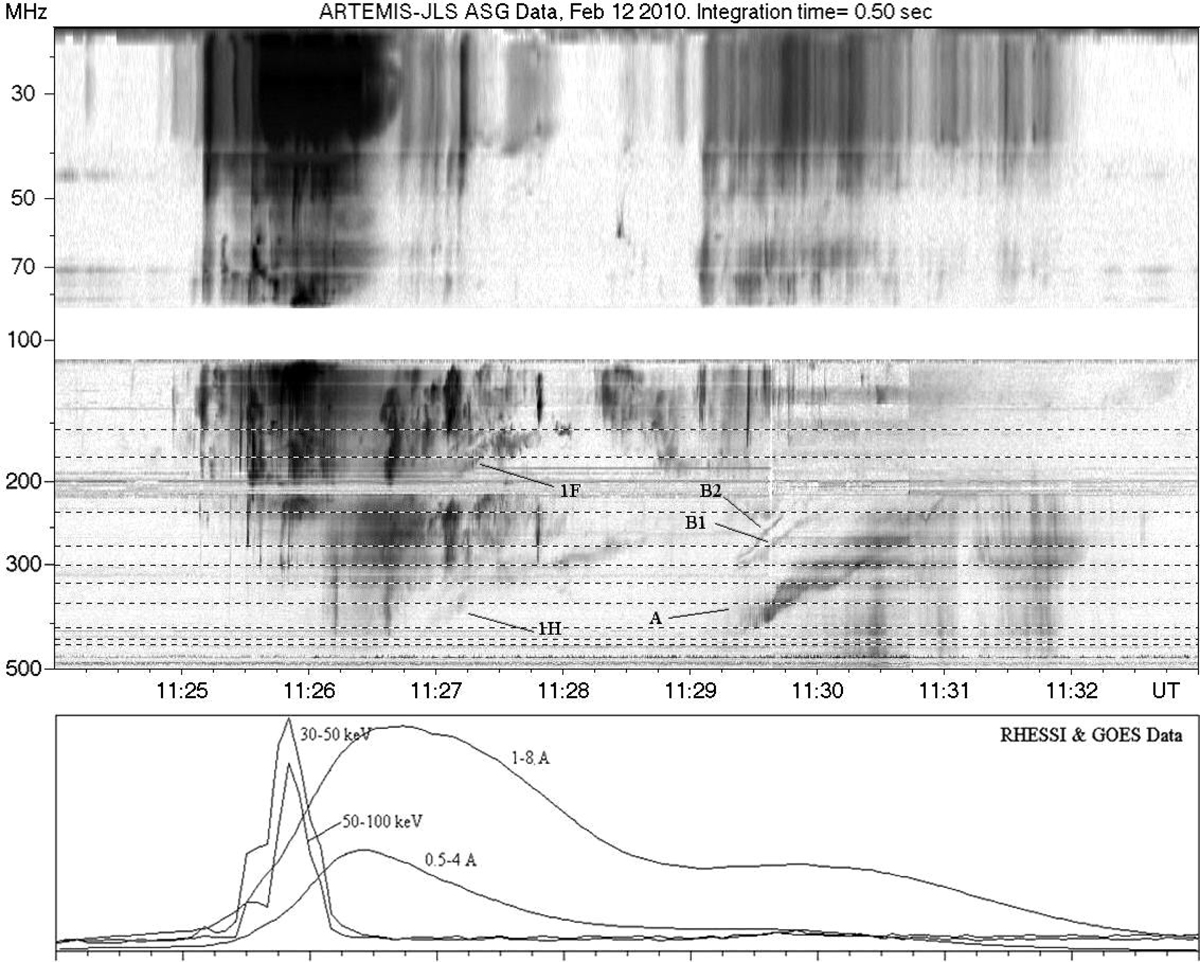
Fig. 1.
Download original image
Dynamic spectrum (negative) of the February 12, 2010 event (500 to 20 MHz), observed with the ASG receiver of the ARTEMIS-JLS radiospectrograph, together with light curves in soft X-rays from GOES and hard X-rays from RHESSI in arbitrary units and on a linear scale. Dashed horizontal lines mark the frequencies of the Nançay Radioheliograph. 1F and 1H mark the fundamental and harmonic emission of the first type-II burst, A, B1 and B2 mark the branches of the second type-II.
Current usage metrics show cumulative count of Article Views (full-text article views including HTML views, PDF and ePub downloads, according to the available data) and Abstracts Views on Vision4Press platform.
Data correspond to usage on the plateform after 2015. The current usage metrics is available 48-96 hours after online publication and is updated daily on week days.
Initial download of the metrics may take a while.