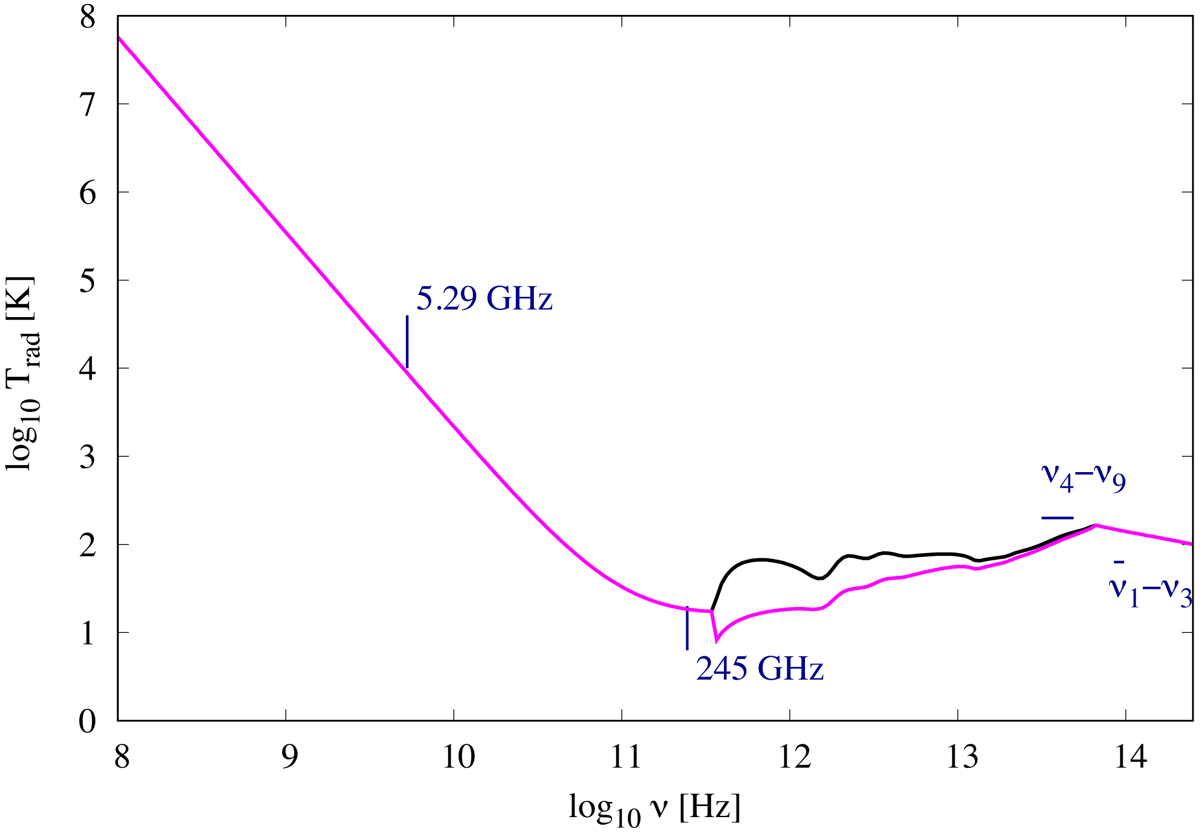
Fig. B.2.
Download original image
Corresponding internal spectral energy distribution of IC 860 presented in the form of a radiation brightness temperature Trad. As in Fig. B.1, the brightness in the infrared-to-submillimeter is elevated at φ = 1 (black curve) compared to φ = 0.1 (magenta) throughout the submillimeter-to-infrared region. Frequencies of 5.29 GHz (where Trad ≈ 8791 K) and 245 GHz (where Trad ≈ 18 K) are marked. Short horizontal bars indicate the frequencies covered by the ν1 to ν3 and the ν4 to ν9 vibrational fundamental bands of CH2NH, where Trad ≈ 100 K.
Current usage metrics show cumulative count of Article Views (full-text article views including HTML views, PDF and ePub downloads, according to the available data) and Abstracts Views on Vision4Press platform.
Data correspond to usage on the plateform after 2015. The current usage metrics is available 48-96 hours after online publication and is updated daily on week days.
Initial download of the metrics may take a while.