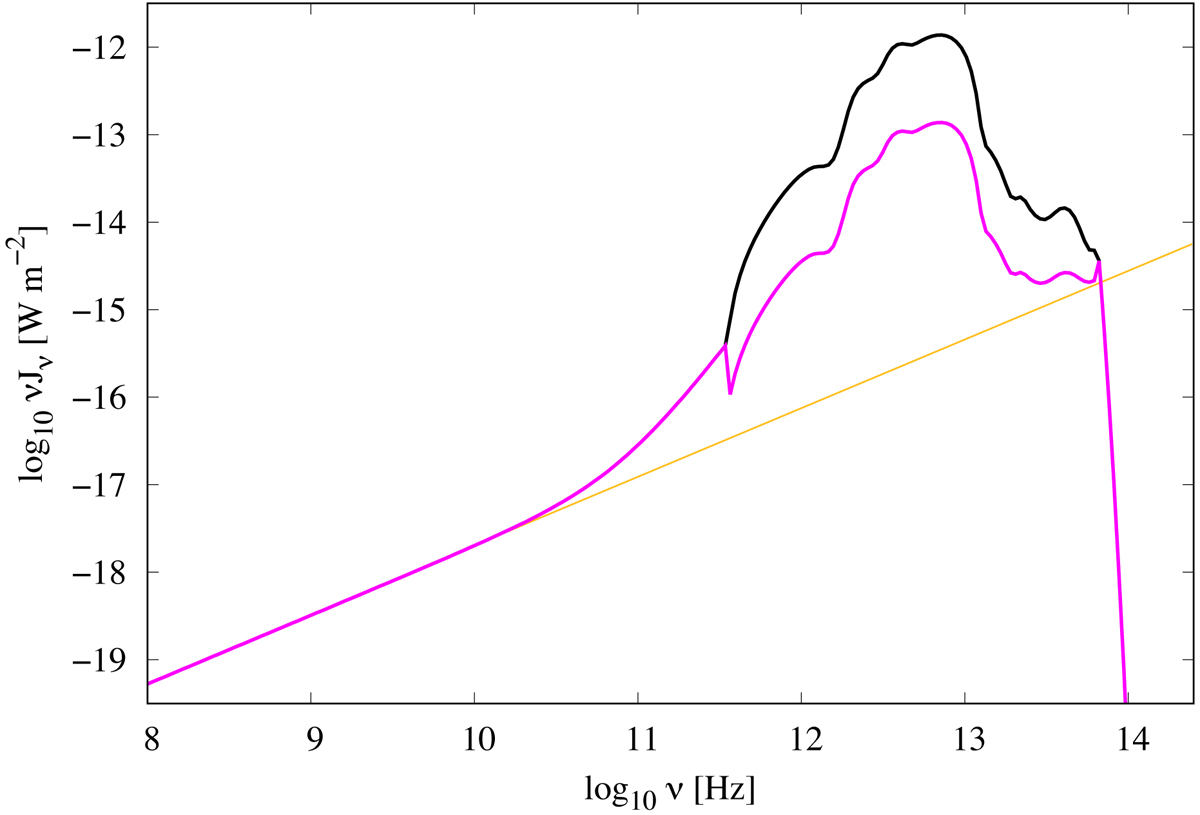
Fig. B.1.
Download original image
Internal spectral energy distribution of IC 860 with an effective solid angle Ω = 3 × 10⁻¹² sr and a total power L = 6 × 10¹¹ L⊙. The upper curve (black in the submillimeter and infrared log ν = 11.5 to 13.8) shows the brightness for φ = 1, while the lower curve (magenta in the submillimeter and infrared) is the corresponding brightness for φ = 0.1. The orange line indicates the underlying nonthermal power-law source, which dominates at radio frequencies.
Current usage metrics show cumulative count of Article Views (full-text article views including HTML views, PDF and ePub downloads, according to the available data) and Abstracts Views on Vision4Press platform.
Data correspond to usage on the plateform after 2015. The current usage metrics is available 48-96 hours after online publication and is updated daily on week days.
Initial download of the metrics may take a while.