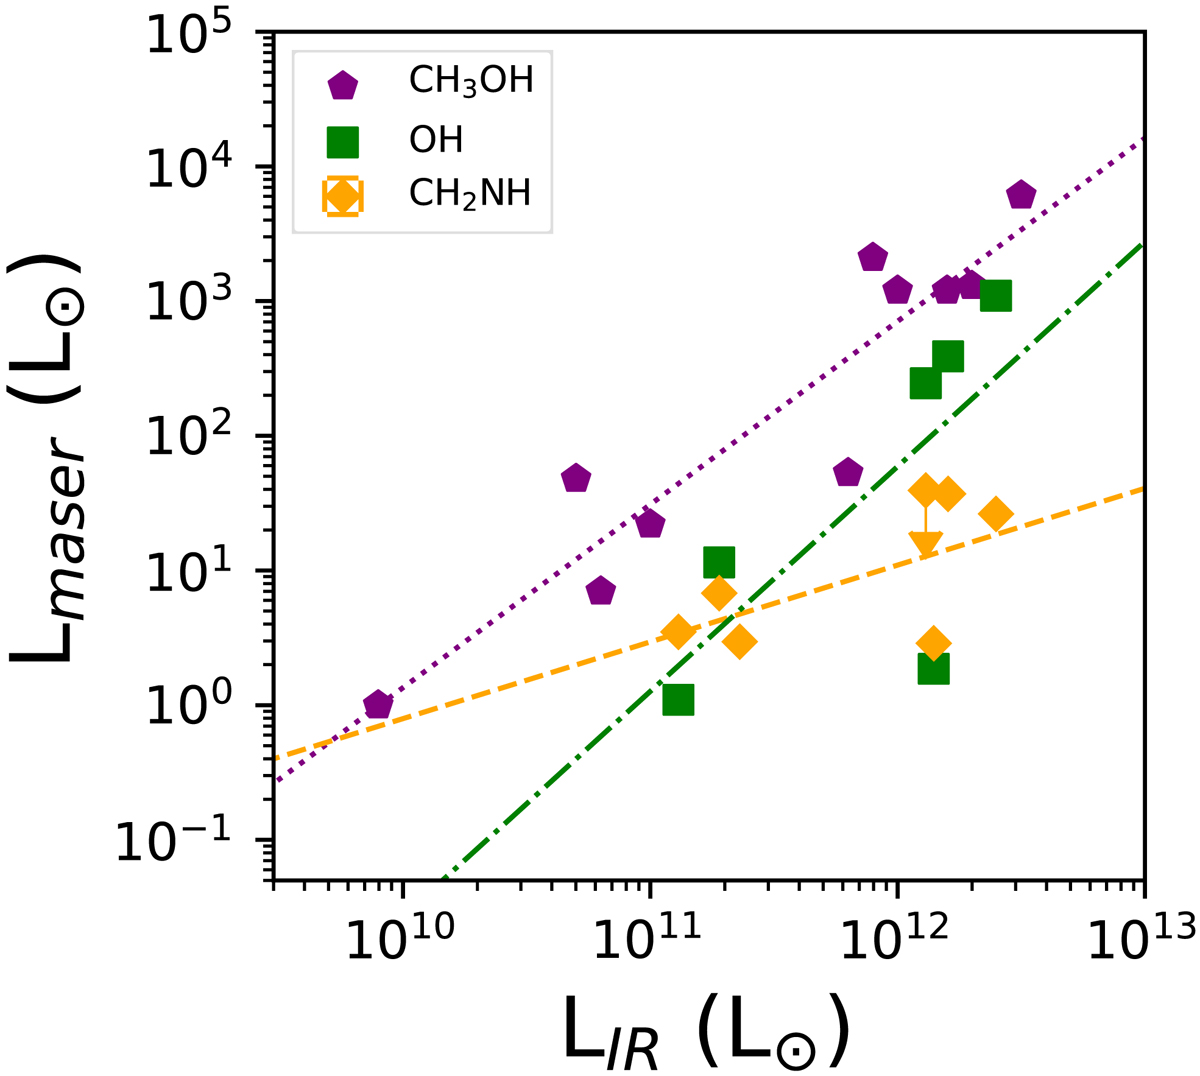
Fig. 4.
Download original image
Relationship between the infrared luminosity of the host galaxy and CH3OH, OH, or CH2NH megamasers. Galaxies with 36 GHz CH3OH masers from Chen et al. (2016) are plotted with purple pentagons, and galaxies with CH2NH masers are plotted with orange diamonds. OH megamasers for six of the seven CONs (all except IRAS 17578−0400) from Darling & Giovanelli (2002) and Wiggins et al. (2016) are plotted with green squares. The infrared luminosity of the galaxies are adopted from Sanders et al. (2003). The purple dotted line represents the linear best fit to the CH3OH data from Chen et al. (2016), the orange dashed line represents the best fit to the CH2NH data (this paper), and the green dashed dotted line is the linear best fit to the OH maser luminosities from Darling & Giovanelli (2002) and Wiggins et al. (2016).
Current usage metrics show cumulative count of Article Views (full-text article views including HTML views, PDF and ePub downloads, according to the available data) and Abstracts Views on Vision4Press platform.
Data correspond to usage on the plateform after 2015. The current usage metrics is available 48-96 hours after online publication and is updated daily on week days.
Initial download of the metrics may take a while.