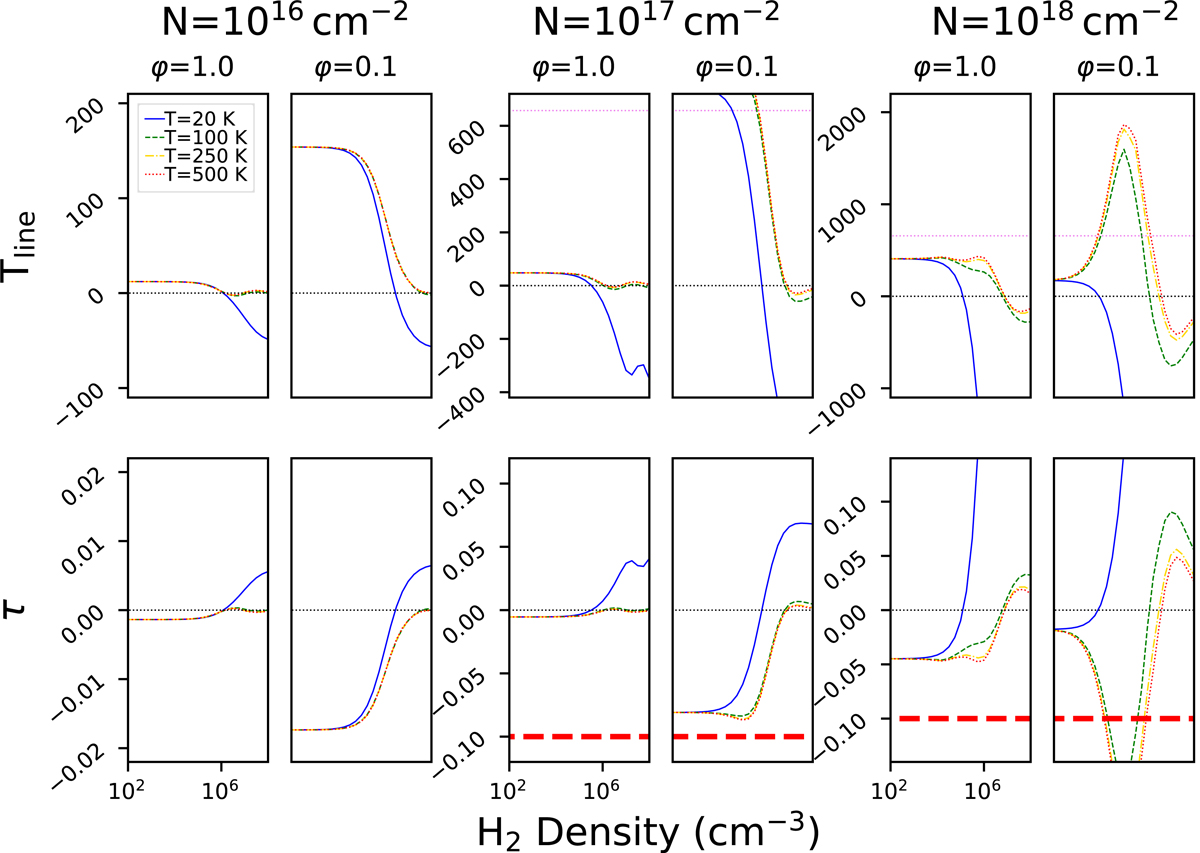
Fig. 3.
Download original image
Non-LTE models showing radiative excitation of the 5.29 GHz CH2NH line. Top row: line radiation temperature, bottom row: optical depth. The horizontal axis in all plots is the H2 density. The horizontal black dotted line indicates a vertical axis value of 0.0 on each plot. The violet horizontal dotted line indicates the observed brightness temperature toward IC 860. The horizontal thick red dashed line indicates the optical depth limit indicated by van der Tak et al. (2007) as line brightness temperatures may not be trusted if the optical depth is less than −0.1. Column densities for each pair of φ are labeled at the top of each pair of columns. Temperatures of the molecular gas are labeled in the upper left corner. The line width input to the mean escape probability approximation is 100 km s−1. The maser action of CH2NH in an infrared radiation field is observed in all cases from 102 cm−2 to ∼105 cm−2.
Current usage metrics show cumulative count of Article Views (full-text article views including HTML views, PDF and ePub downloads, according to the available data) and Abstracts Views on Vision4Press platform.
Data correspond to usage on the plateform after 2015. The current usage metrics is available 48-96 hours after online publication and is updated daily on week days.
Initial download of the metrics may take a while.