Fig. 2
Download original image
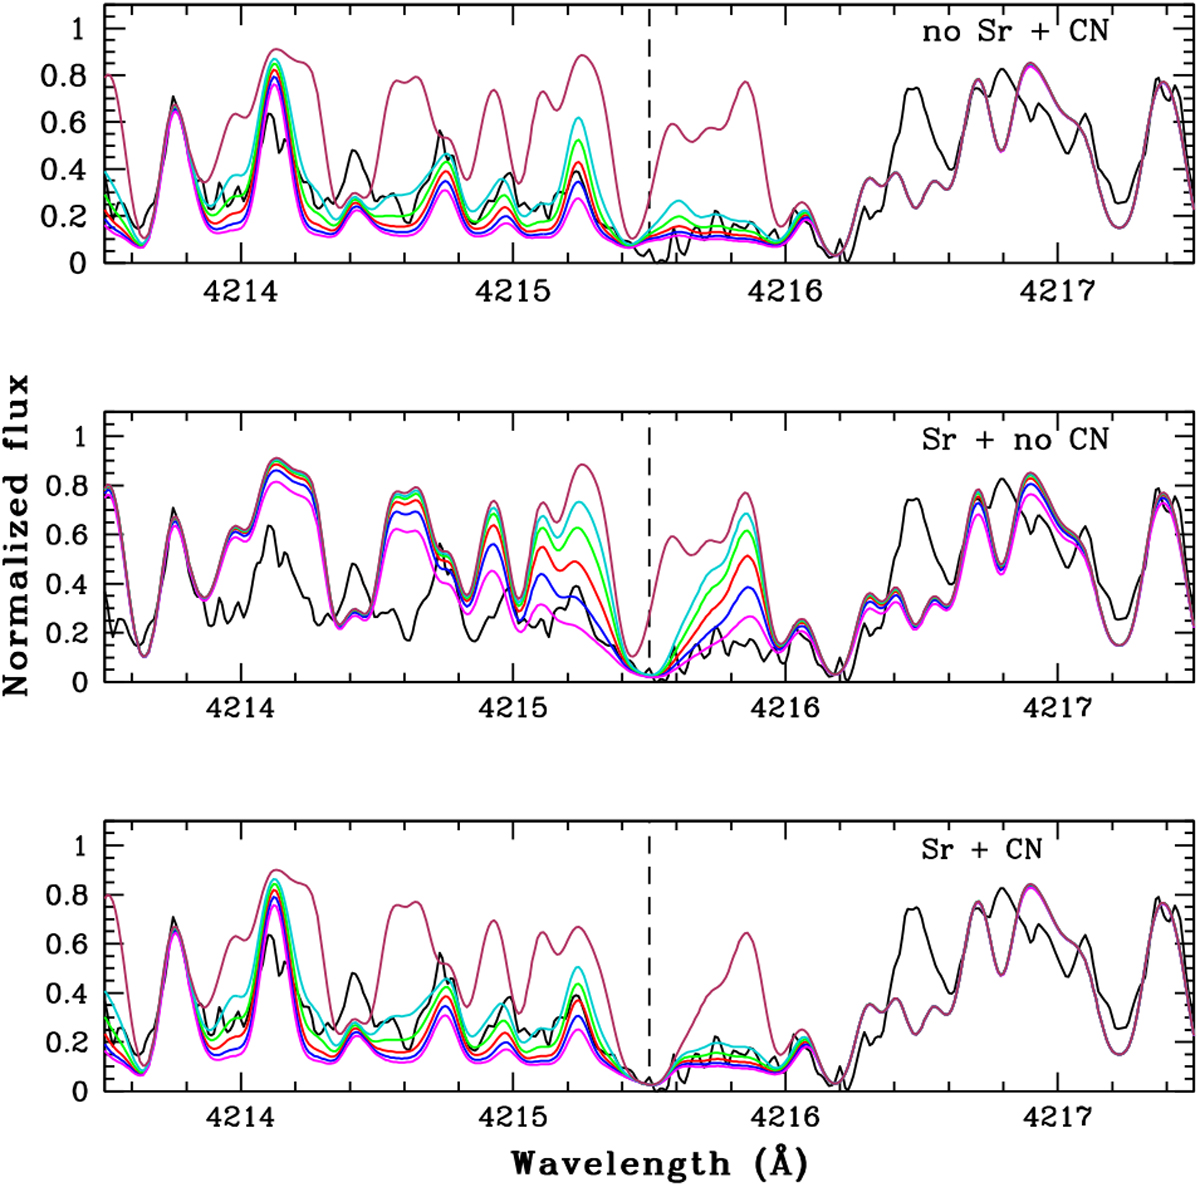
Spectral syntheses of the 4214–4217 Å wavelength range surrounding the Sr II 4215.519 Å line in HD 7863. Top panel: spectral syntheses do not include the Sr II 4215.519 Å line, to reveal the impact of the 4216 Å CN band head. The magenta, blue, red, green and turquoise lines correspond to log ϵ (N) = 9.15, 8.85, 8.55, 8.25 and 7.95 dex, respectively. The brown line is a synthesis without N (and no Sr). Middle panel: contribution from the CN band is removed and spectral syntheses are computed by varying only the Sr abundance. In this case, the magenta, blue, red, green and turquoise lines correspond to log ϵ (Sr) = 3.6, 3.3, 3.0, 2.7 and 2.4 dex, respectively. The brown line is the synthesis without Sr and N. Bottom panel: synthesis include both the Sr II 4215.519 Å line and the CN bandhead, with the Sr abundance of Table A.2 (log ϵ(Sr) = 2.58) and various N abundances, with the same colour-coding as in the top panel. The brown line is the synthesis without N. The adopted 12C/13C ratio is 19.
Current usage metrics show cumulative count of Article Views (full-text article views including HTML views, PDF and ePub downloads, according to the available data) and Abstracts Views on Vision4Press platform.
Data correspond to usage on the plateform after 2015. The current usage metrics is available 48-96 hours after online publication and is updated daily on week days.
Initial download of the metrics may take a while.