Free Access
Fig. 1.
Download original image
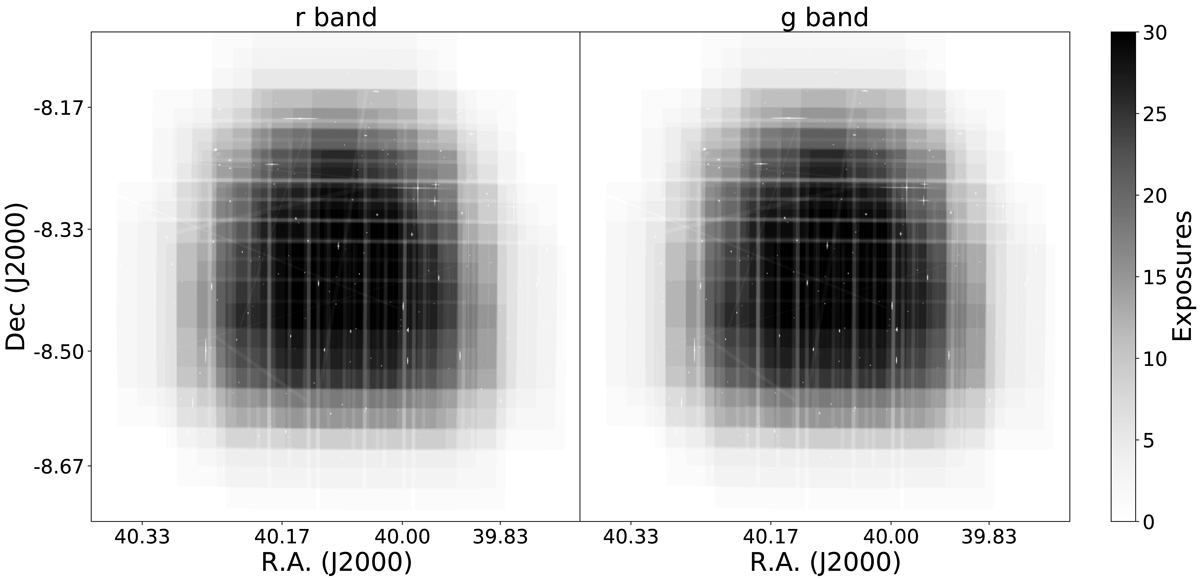
Weight maps in the Sloan g- and r-bands after the stacking process. Darker areas correspond to a larger number of repetitions and consequently deeper imaging. The dithering pattern followed in this observation is clearly visible. North is up and east to the left.
Current usage metrics show cumulative count of Article Views (full-text article views including HTML views, PDF and ePub downloads, according to the available data) and Abstracts Views on Vision4Press platform.
Data correspond to usage on the plateform after 2015. The current usage metrics is available 48-96 hours after online publication and is updated daily on week days.
Initial download of the metrics may take a while.