Fig. 8.
Download original image
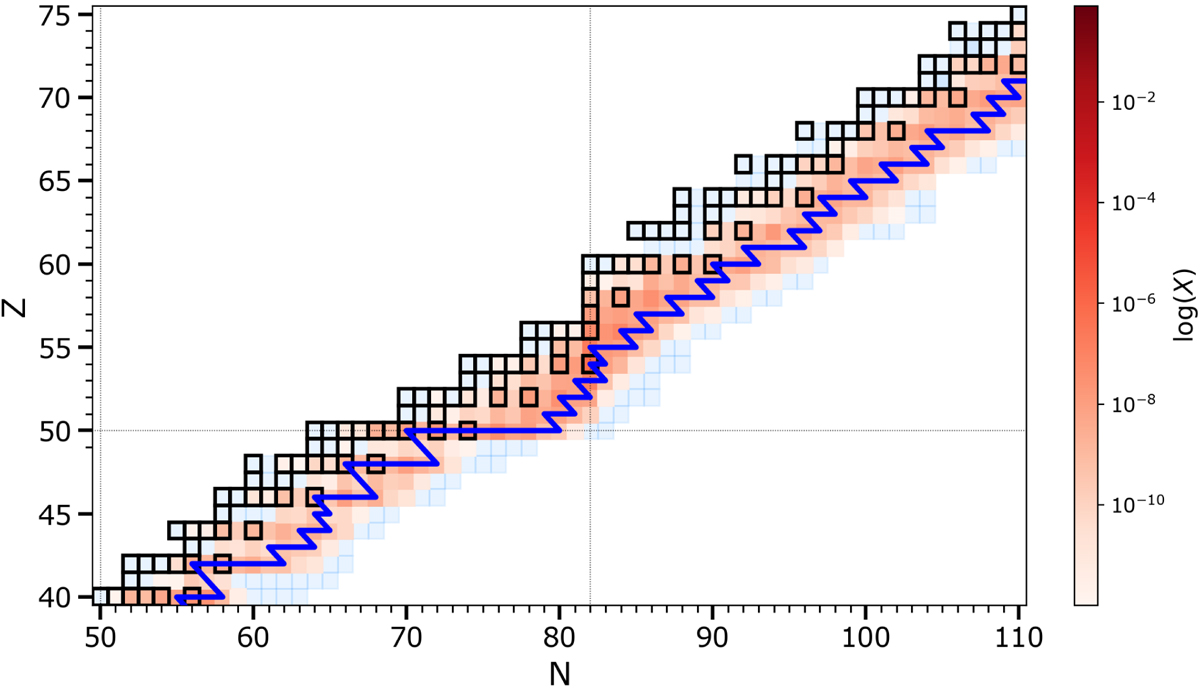
Illustration of the main nuclear i-process flow (blue line) in the layer of 1 M⊙, [Fe/H] = −2.5 model star with the highest neutron density of Nn ≃ 5 × 1014 cm−3. The blue squares correspond to the nuclei included in the network, the black ones to the stable nuclei. The abundances are depicted by the red colour scale in mass fraction. The N = 82 isotones and Z = 50 isotopes are highlighted by the vertical and horizontal dotted lines, respectively.
Current usage metrics show cumulative count of Article Views (full-text article views including HTML views, PDF and ePub downloads, according to the available data) and Abstracts Views on Vision4Press platform.
Data correspond to usage on the plateform after 2015. The current usage metrics is available 48-96 hours after online publication and is updated daily on week days.
Initial download of the metrics may take a while.