Fig. 5.
Download original image
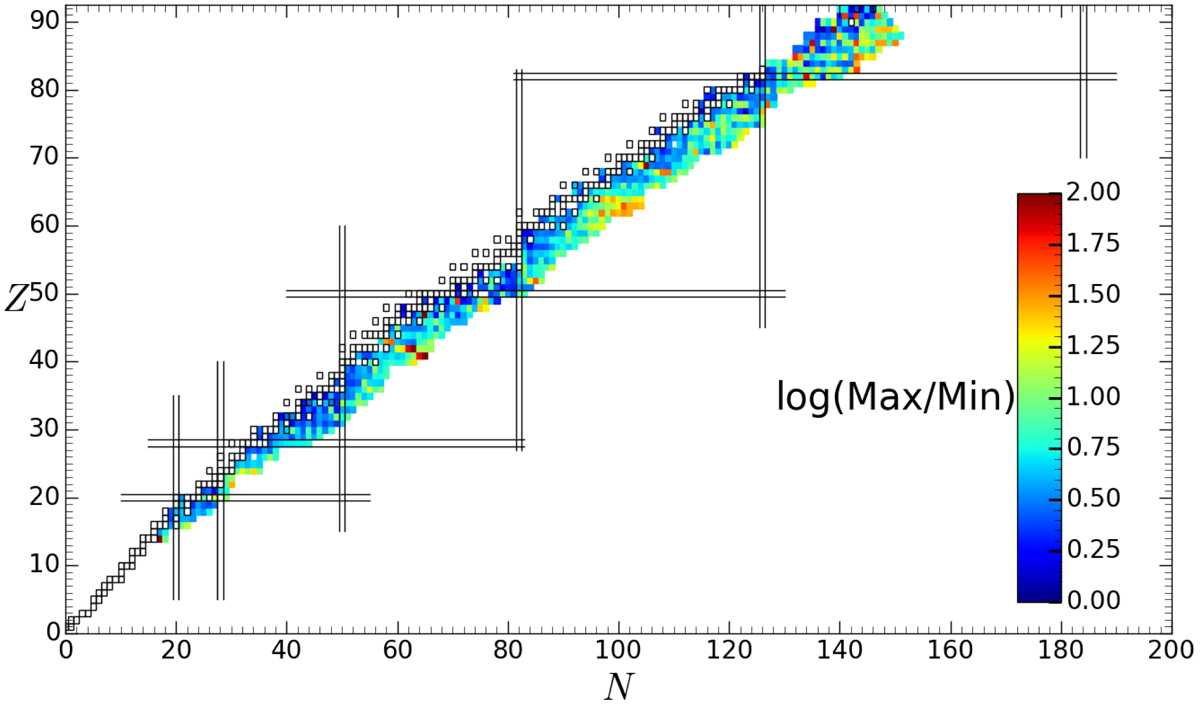
Representation in the (N, Z) plane of the ratio between the maximum and minimum estimates of the neutron capture rates at T = 2.5 108 K between the ten TALYS sets for all the 793 nuclei with 14 ≤ Z ≤ 93 included in the i-process network and for which no experimental data exist. The black open squares correspond to stable nuclei.
Current usage metrics show cumulative count of Article Views (full-text article views including HTML views, PDF and ePub downloads, according to the available data) and Abstracts Views on Vision4Press platform.
Data correspond to usage on the plateform after 2015. The current usage metrics is available 48-96 hours after online publication and is updated daily on week days.
Initial download of the metrics may take a while.