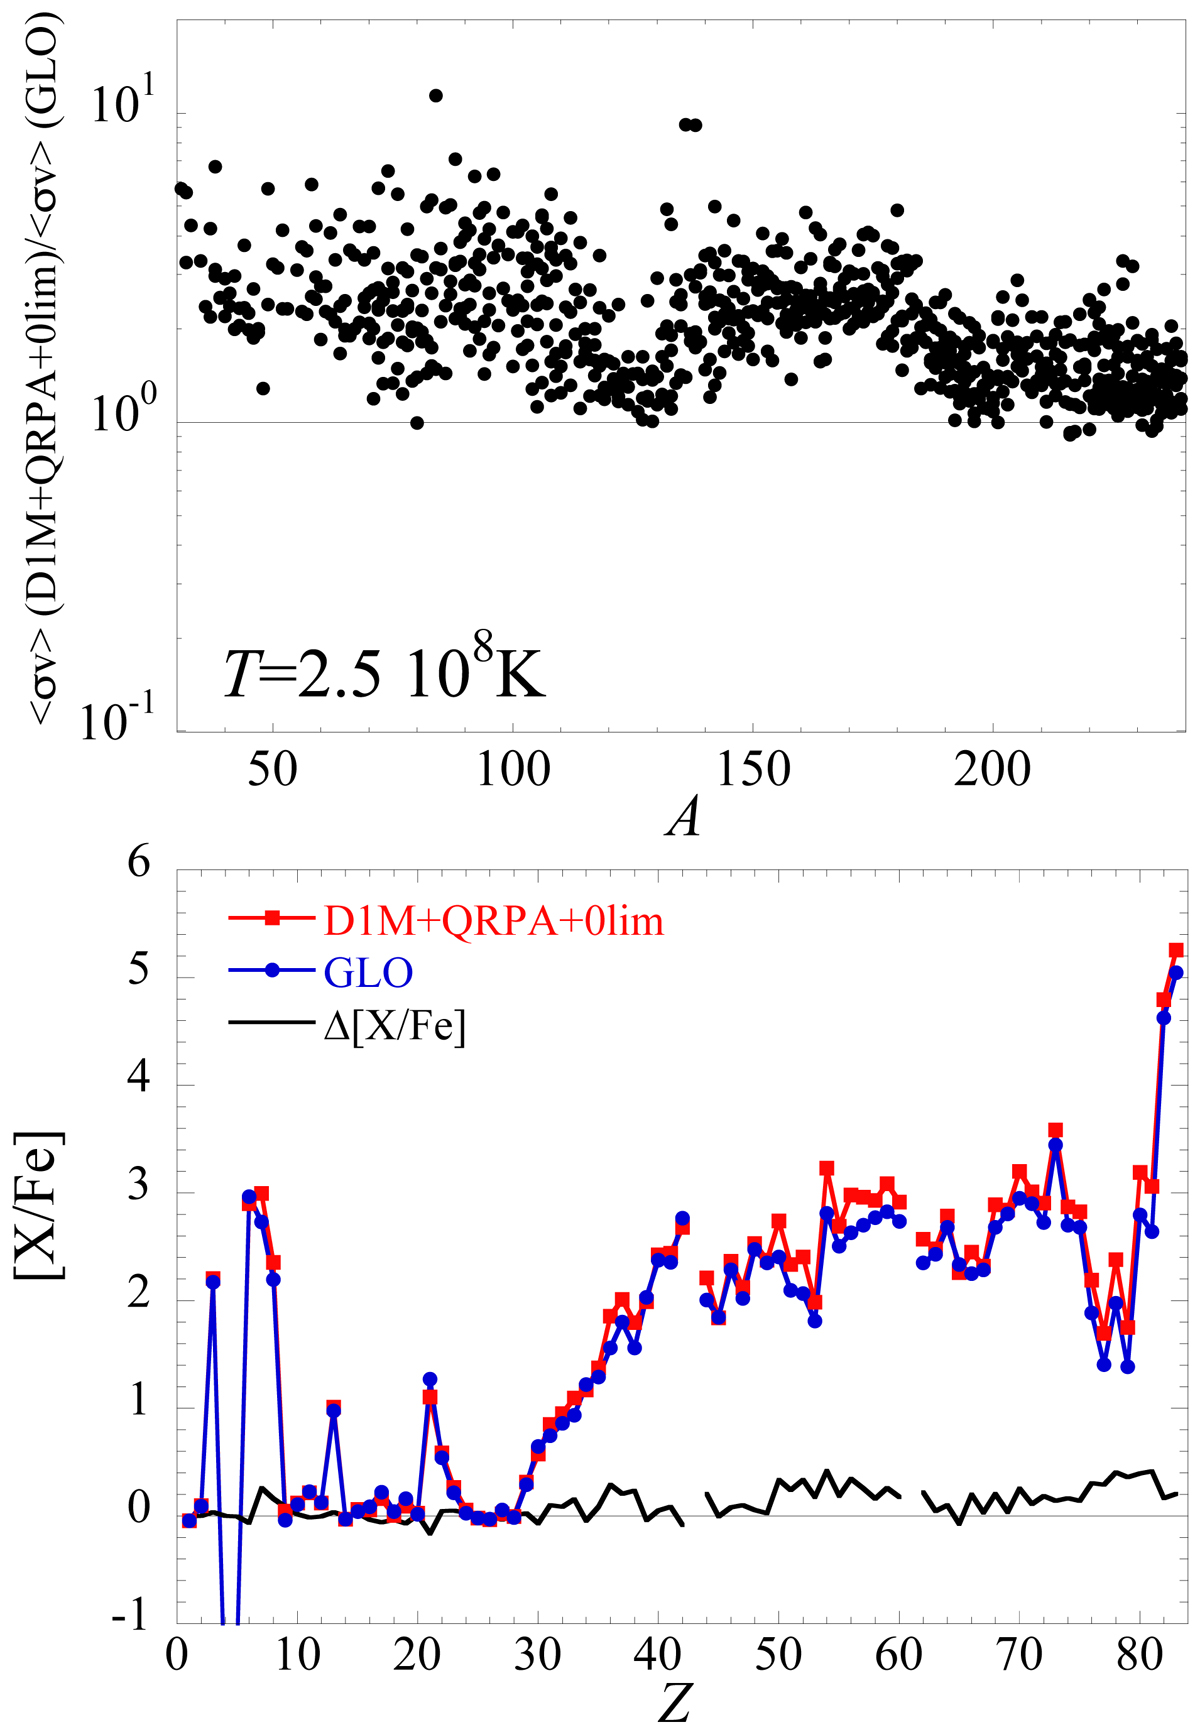
Fig. 2.
Download original image
Upper panel: ratio between the neutron capture rates at T = 2.5 108 K obtained with the D1M+QRPA+0lim (Goriely et al. 2018) and those obtained with the GLO (Kopecky & Uhl 1990; Capote et al. 2009) photon strength functions, for all the 793 nuclei with 14 ≤ Z ≤ 93 included in the i-process network and for which no experimental data exist. Lower panel: surface elemental overabundances resulting from the i-process in the 1 M⊙, [Fe/H] = −2.5 model star when adopting TALYS radiative neutron capture rates obtained either with the D1M+QRPA+0lim or GLO photon strength functions. The black line corresponds to the difference in the overabundance between D1M+QRPA+0lim and GLO predictions.
Current usage metrics show cumulative count of Article Views (full-text article views including HTML views, PDF and ePub downloads, according to the available data) and Abstracts Views on Vision4Press platform.
Data correspond to usage on the plateform after 2015. The current usage metrics is available 48-96 hours after online publication and is updated daily on week days.
Initial download of the metrics may take a while.