Fig. 4
Download original image
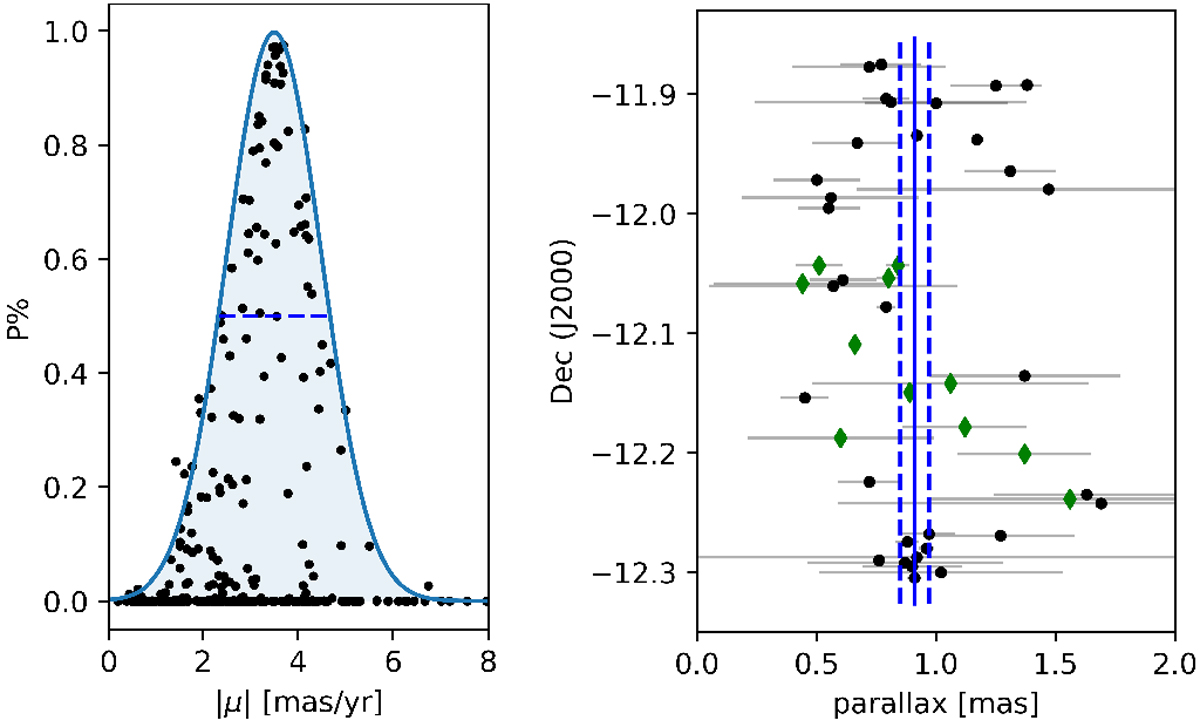
Proper motion and parallax. Left: distribution of membership probabilities as a function of modulus of proper motion. A dashed line is used to separate members from candidates. Right: parallax distribution for the sample showing the observed values of ϖ and respective error bars. Green ♦ symbols indicate the sources found in the secondary structure of the cloud (see Sect. 5). The vertical blue lines indicate the error-weighted mean parallax ⟨ π ⟩ = 0.91 ± 0.02 mas (dashed lines show 3σ deviation).
Current usage metrics show cumulative count of Article Views (full-text article views including HTML views, PDF and ePub downloads, according to the available data) and Abstracts Views on Vision4Press platform.
Data correspond to usage on the plateform after 2015. The current usage metrics is available 48-96 hours after online publication and is updated daily on week days.
Initial download of the metrics may take a while.