Fig. 8.
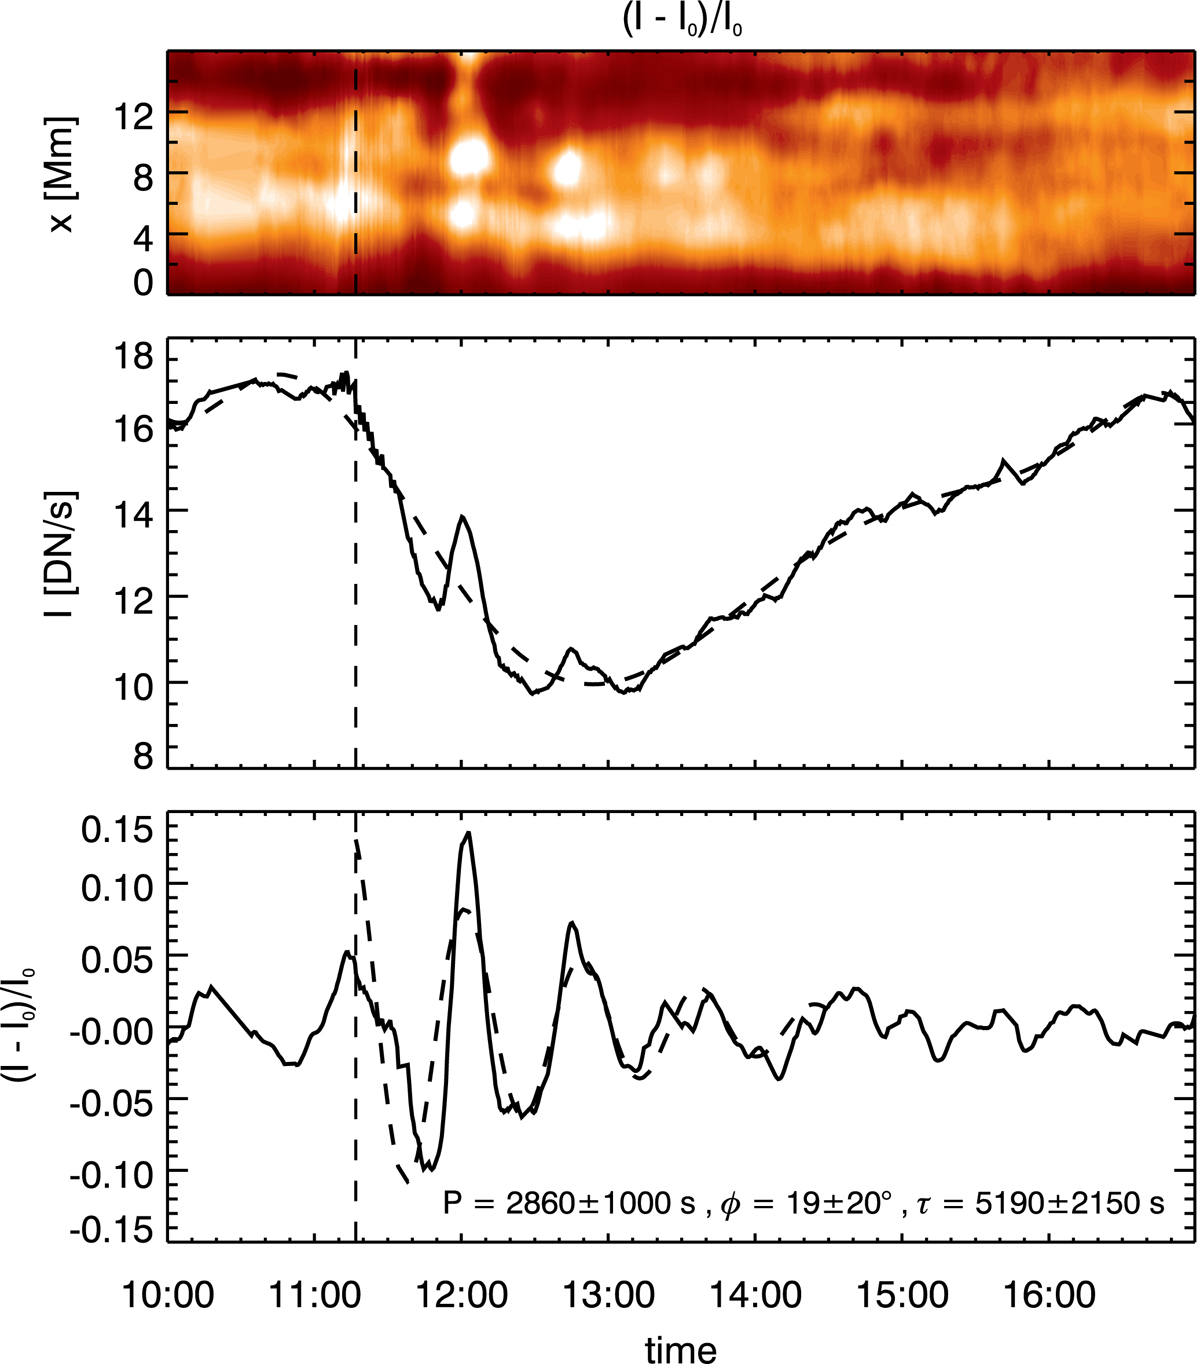
Download original image
Intensity variations at the footpoint of a large loop which supports a transverse oscillation, taken from TRACE observation on September 15 2001. Top: relative intensity of the TRACE 2d loop region, averaged over the longitudinal coordinate from the foot point up to 22 Mm, as a function of time and transverse distance. The vertical dashed line indicates the reference time t0. Middle: intensity of the same region, averaged over transverse distance, as a function of time. The dashed line is a smooth trend that is taken to be the background intensity. Bottom: relative intensity fitted with a damped oscillator between times t0 and t1, is shown as a dashed curve. Reproduced from Verwichte et al. (2010).
Current usage metrics show cumulative count of Article Views (full-text article views including HTML views, PDF and ePub downloads, according to the available data) and Abstracts Views on Vision4Press platform.
Data correspond to usage on the plateform after 2015. The current usage metrics is available 48-96 hours after online publication and is updated daily on week days.
Initial download of the metrics may take a while.