Fig. 3.
Download original image
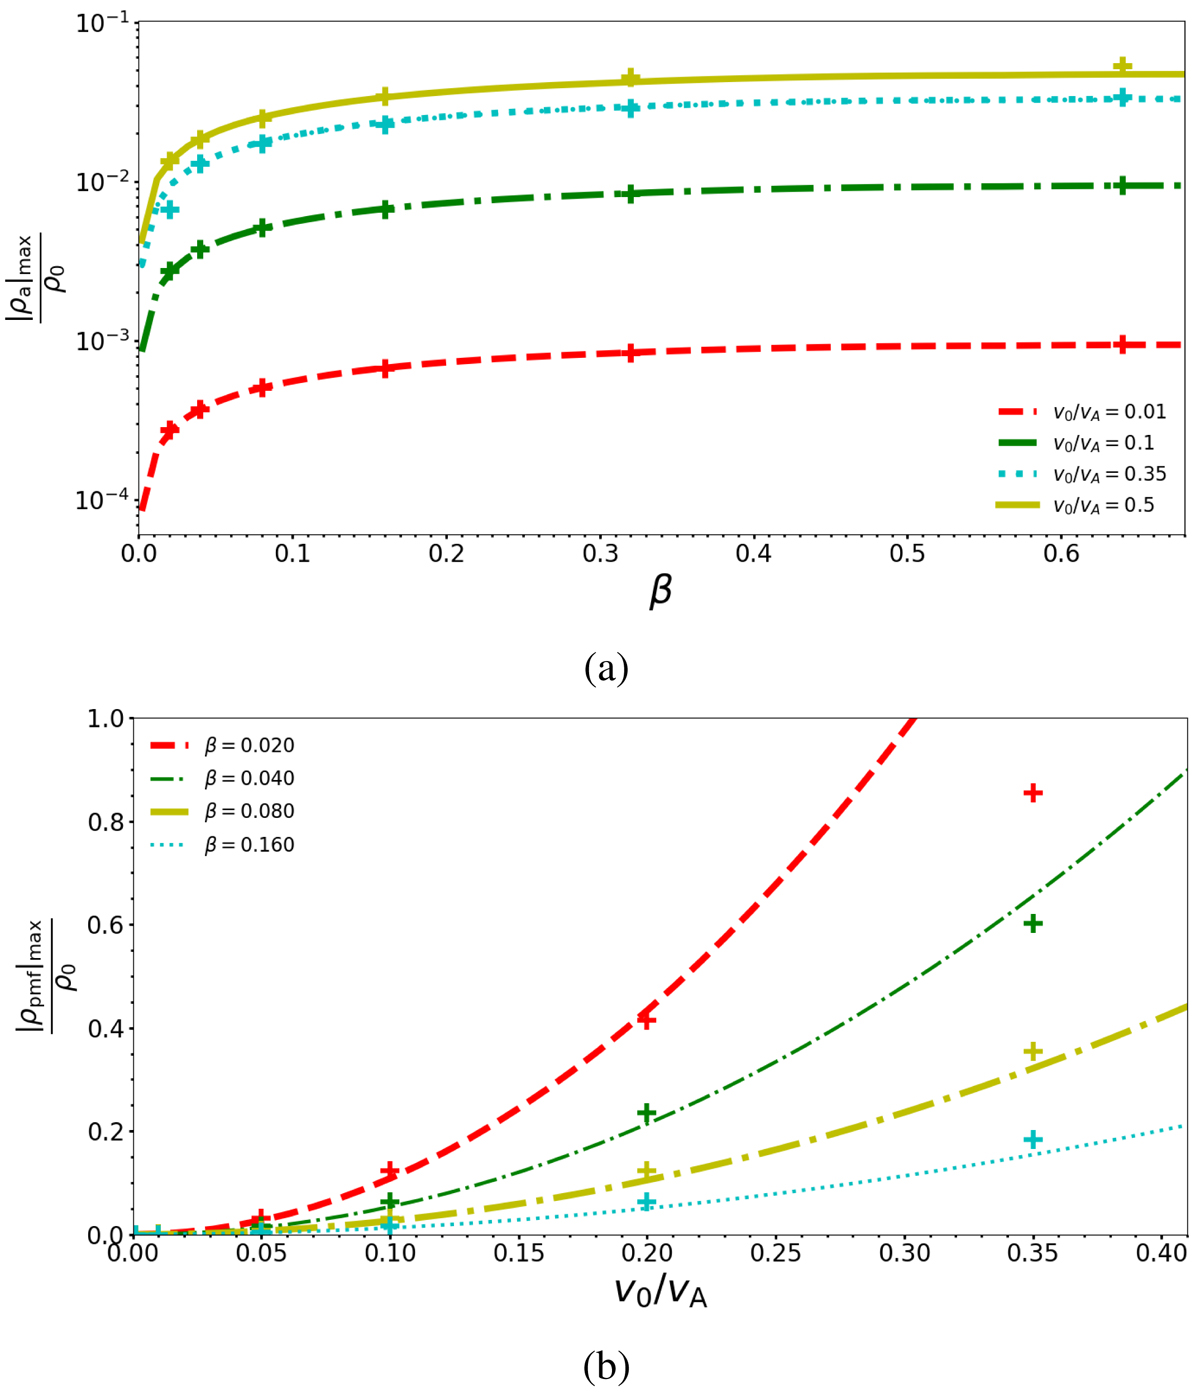
(a) Relative maximum slow mode density perturbation as a function of plasma-β for four different initial velocity amplitude v0. Lines represent the predicted analytical solution and crosses represent the numerical values. (b) Relative density perturbation amplitude due to the pondermotive force as a function of v0 for four different plasma-β values, taken at the point x = 0 and y = 0 where maximum.
Current usage metrics show cumulative count of Article Views (full-text article views including HTML views, PDF and ePub downloads, according to the available data) and Abstracts Views on Vision4Press platform.
Data correspond to usage on the plateform after 2015. The current usage metrics is available 48-96 hours after online publication and is updated daily on week days.
Initial download of the metrics may take a while.