Fig. 1.
Download original image
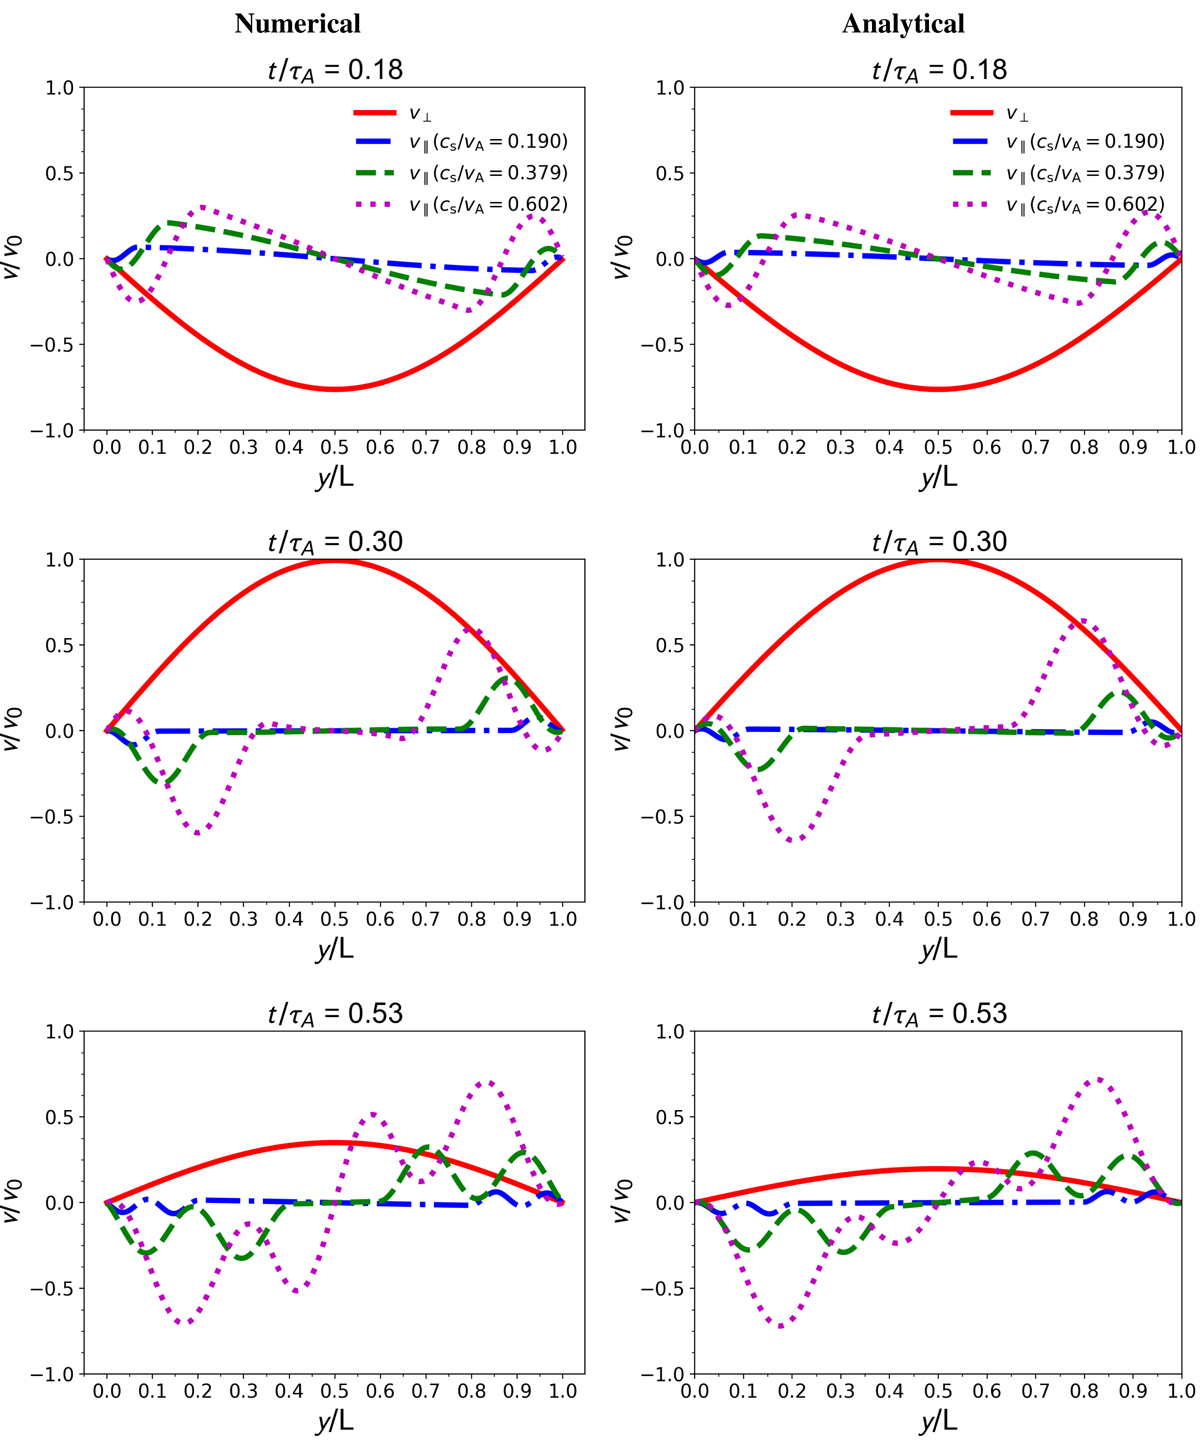
Profiles of the parallel and perpendicular velocity as a function of y, for three times. Velocities are normalised with respect to the initial velocity amplitude. Time is normalised by the Alfvén travel time τA = 2L/vA. The solid line represents the perpendicular velocity, which is approximately the same for varying sound speeds. The transverse velocity is taken at x = πL/20 where maximum and the parallel velocity at x = 0 where also maximum. The dotted dashed, dashed and dotted lines are the parallel velocity profiles for cS/vA = 0.190, 0.379, 0.602, respectively. The velocity has been multiplied by a factor four for clarity. Left panels: results from the Lare2d numerical simulation. Right panels: analytical solution Eq. (24).
Current usage metrics show cumulative count of Article Views (full-text article views including HTML views, PDF and ePub downloads, according to the available data) and Abstracts Views on Vision4Press platform.
Data correspond to usage on the plateform after 2015. The current usage metrics is available 48-96 hours after online publication and is updated daily on week days.
Initial download of the metrics may take a while.