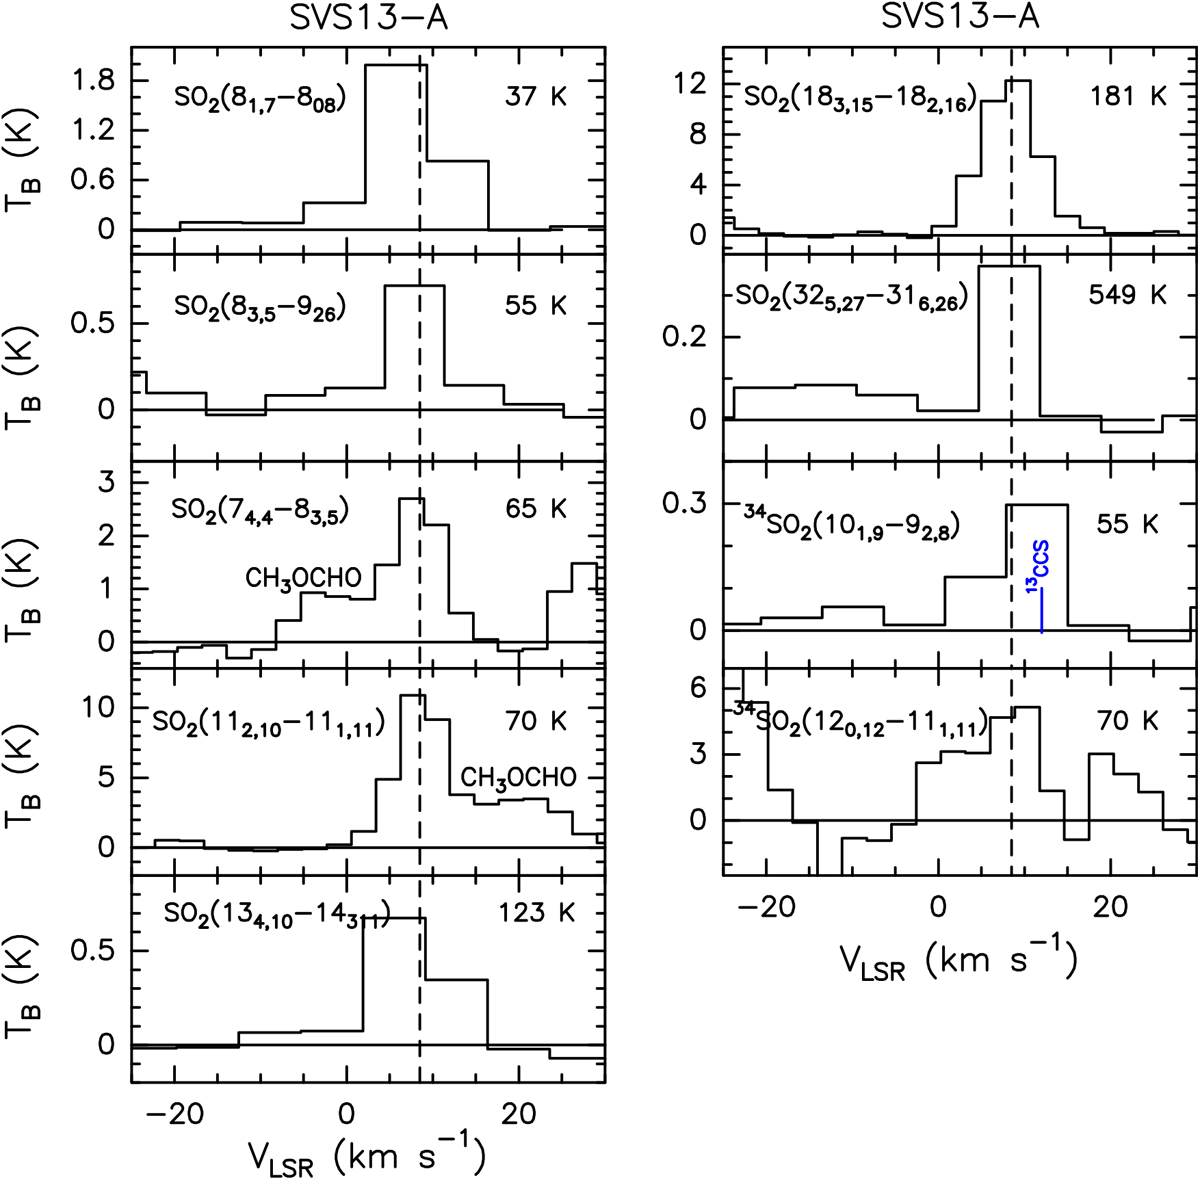
Fig. 7
Download original image
Observed SO2, 34SO2, and 33SO2 spectra (in TB scale, see Table 1) extracted at the emission peak: α2000 = 03h29m03.s75, δ2000 = +31°16′03.′′8. Transitions and corresponding upper level energies are reported. The vertical dashed line stands for the ambient LSR velocity (+8.6 km s−1, Chen et al. 2009). The 34SO2 line at Eu = 55 K could be contaminated by 13CCS emission with Eu = 22 K (see Table 1).
Current usage metrics show cumulative count of Article Views (full-text article views including HTML views, PDF and ePub downloads, according to the available data) and Abstracts Views on Vision4Press platform.
Data correspond to usage on the plateform after 2015. The current usage metrics is available 48-96 hours after online publication and is updated daily on week days.
Initial download of the metrics may take a while.