Fig. 5
Download original image
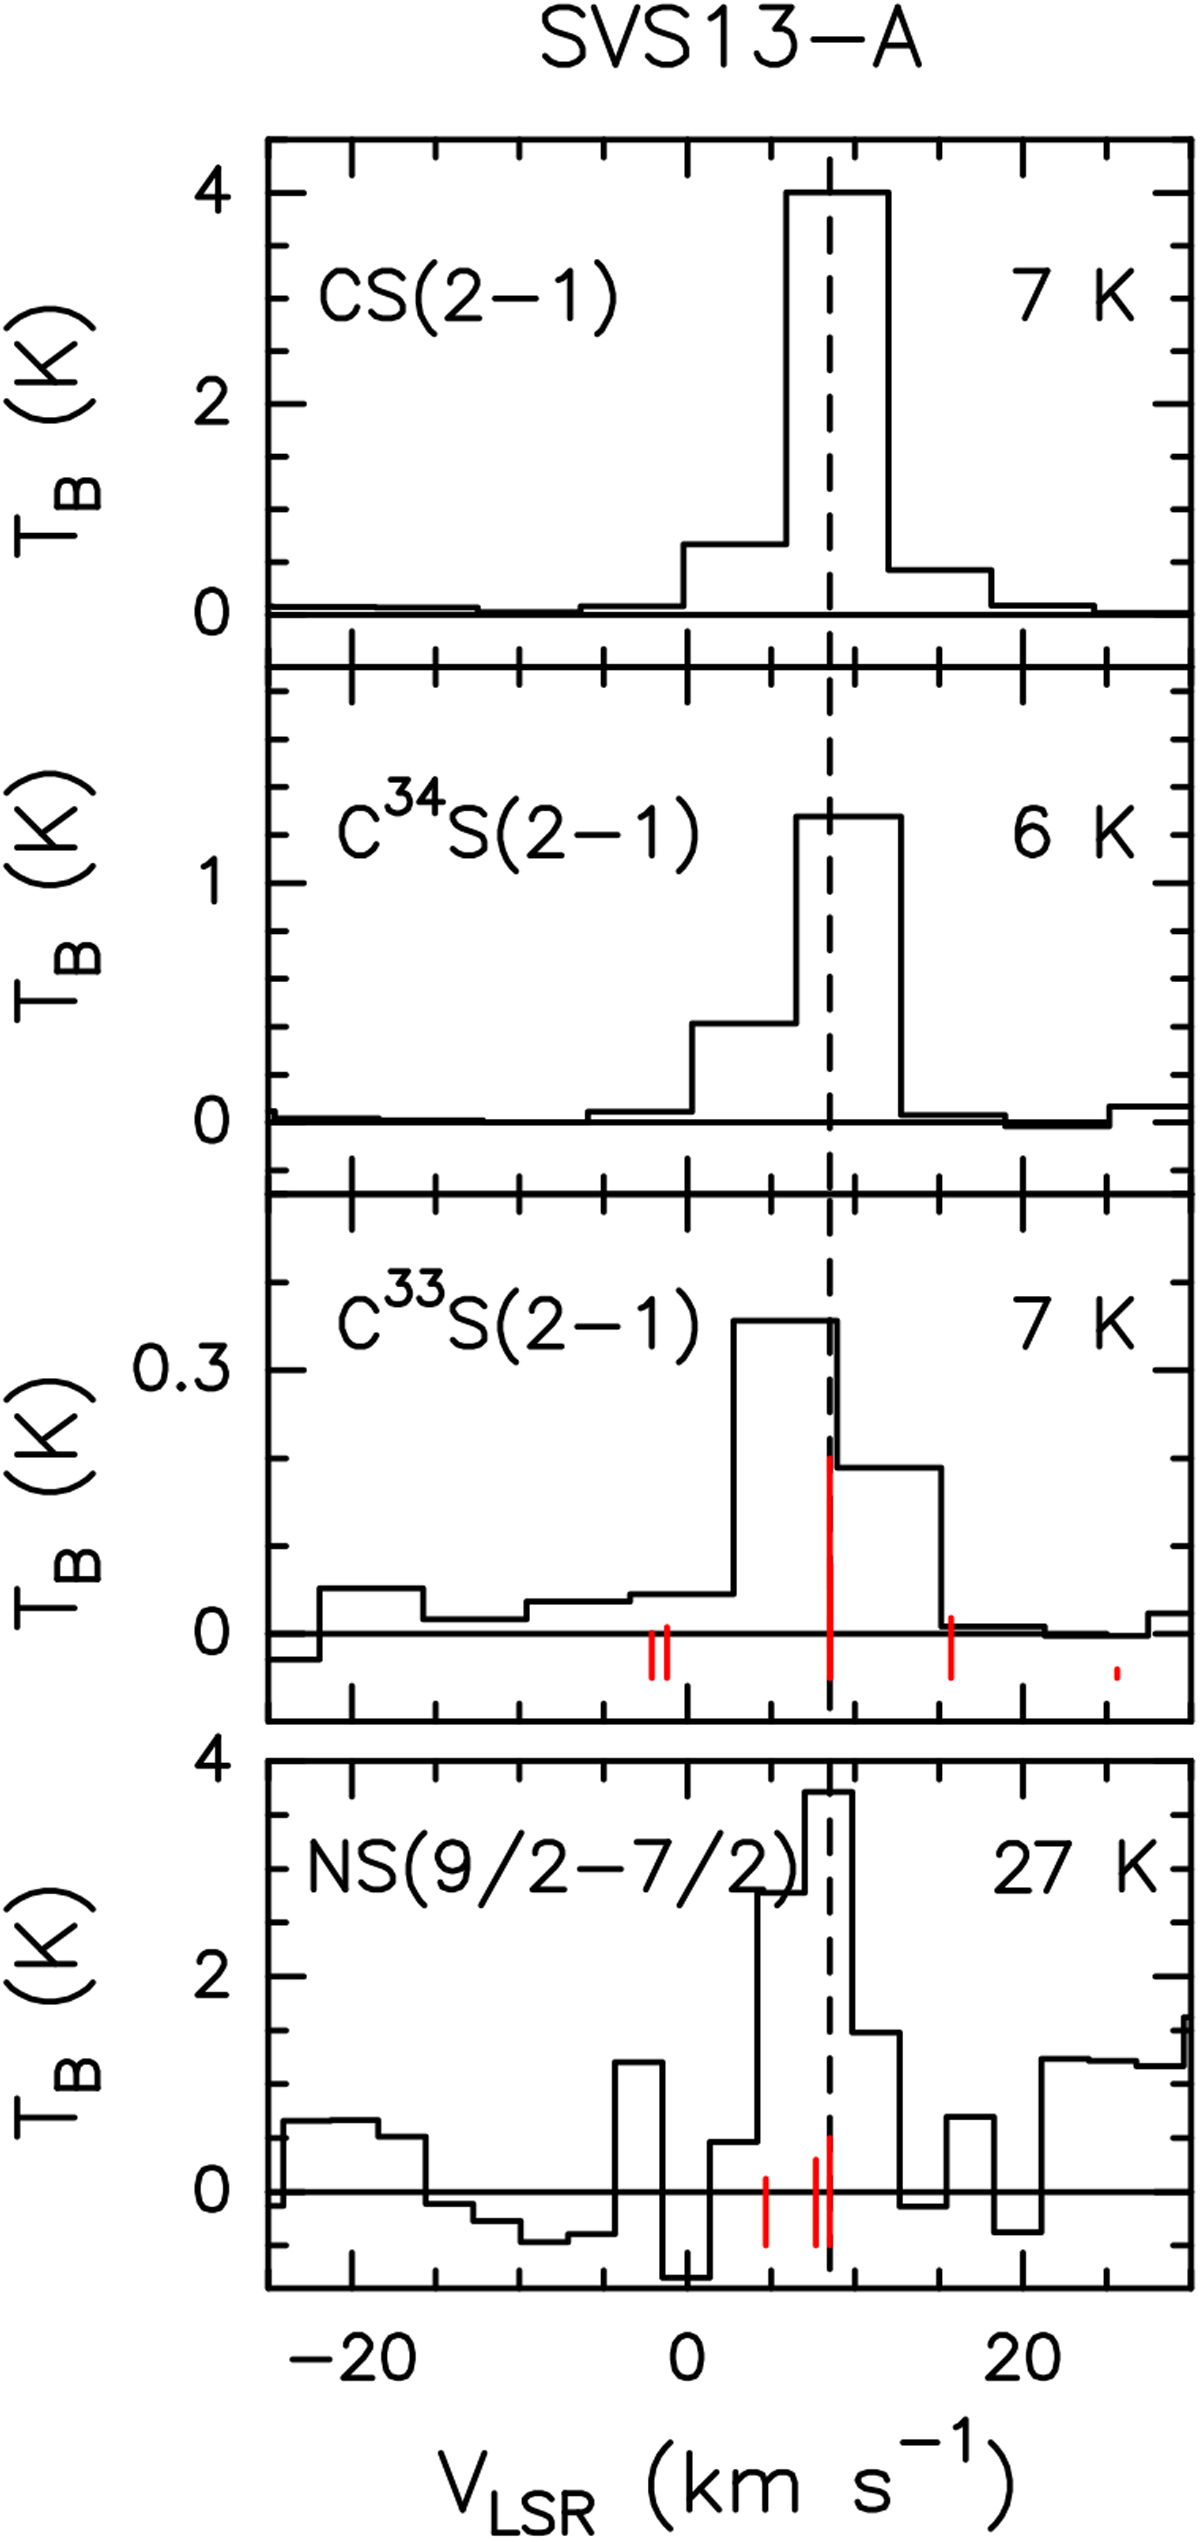
Observed CS, C34S, C33 S, and NS spectra (in TB scale, see Table 1) extracted at the emission peak: α2000 = 03h29m03.s75, δ2000 = +31°16′03.′′8. Transitions and corresponding upper level energies are reported. The vertical dashed line stands for the ambient LSR velocity (+8.6 km s−1, Chen et al. 2009). The C33S(2–1) line consists of six hyperfine components with Sμ2 in the 0.5–12.2 D2 range (Bogey et al. 1981; Lovas 2004; Müller et al. 2005) spread on a 9 MHz frequency interval. The vertical red lines (in scales according to their Sμ2) indicated their relative offset in velocity scale with respect to the brightest F = 5/2–3/2 line. The NS 9/2–7/2 Ω = 1/2 line consists of three hyperfine components (Lee et al. 1995) associated with Sμ2 in the 10.9–17.4 D2 range spread on a 0.6 MHz frequency interval. The vertical red lines (in scales according to their Sμ2) indicated their relative offset in velocity scale with respect to the brightest F = 11/2–9/2 line (see Table 1).
Current usage metrics show cumulative count of Article Views (full-text article views including HTML views, PDF and ePub downloads, according to the available data) and Abstracts Views on Vision4Press platform.
Data correspond to usage on the plateform after 2015. The current usage metrics is available 48-96 hours after online publication and is updated daily on week days.
Initial download of the metrics may take a while.