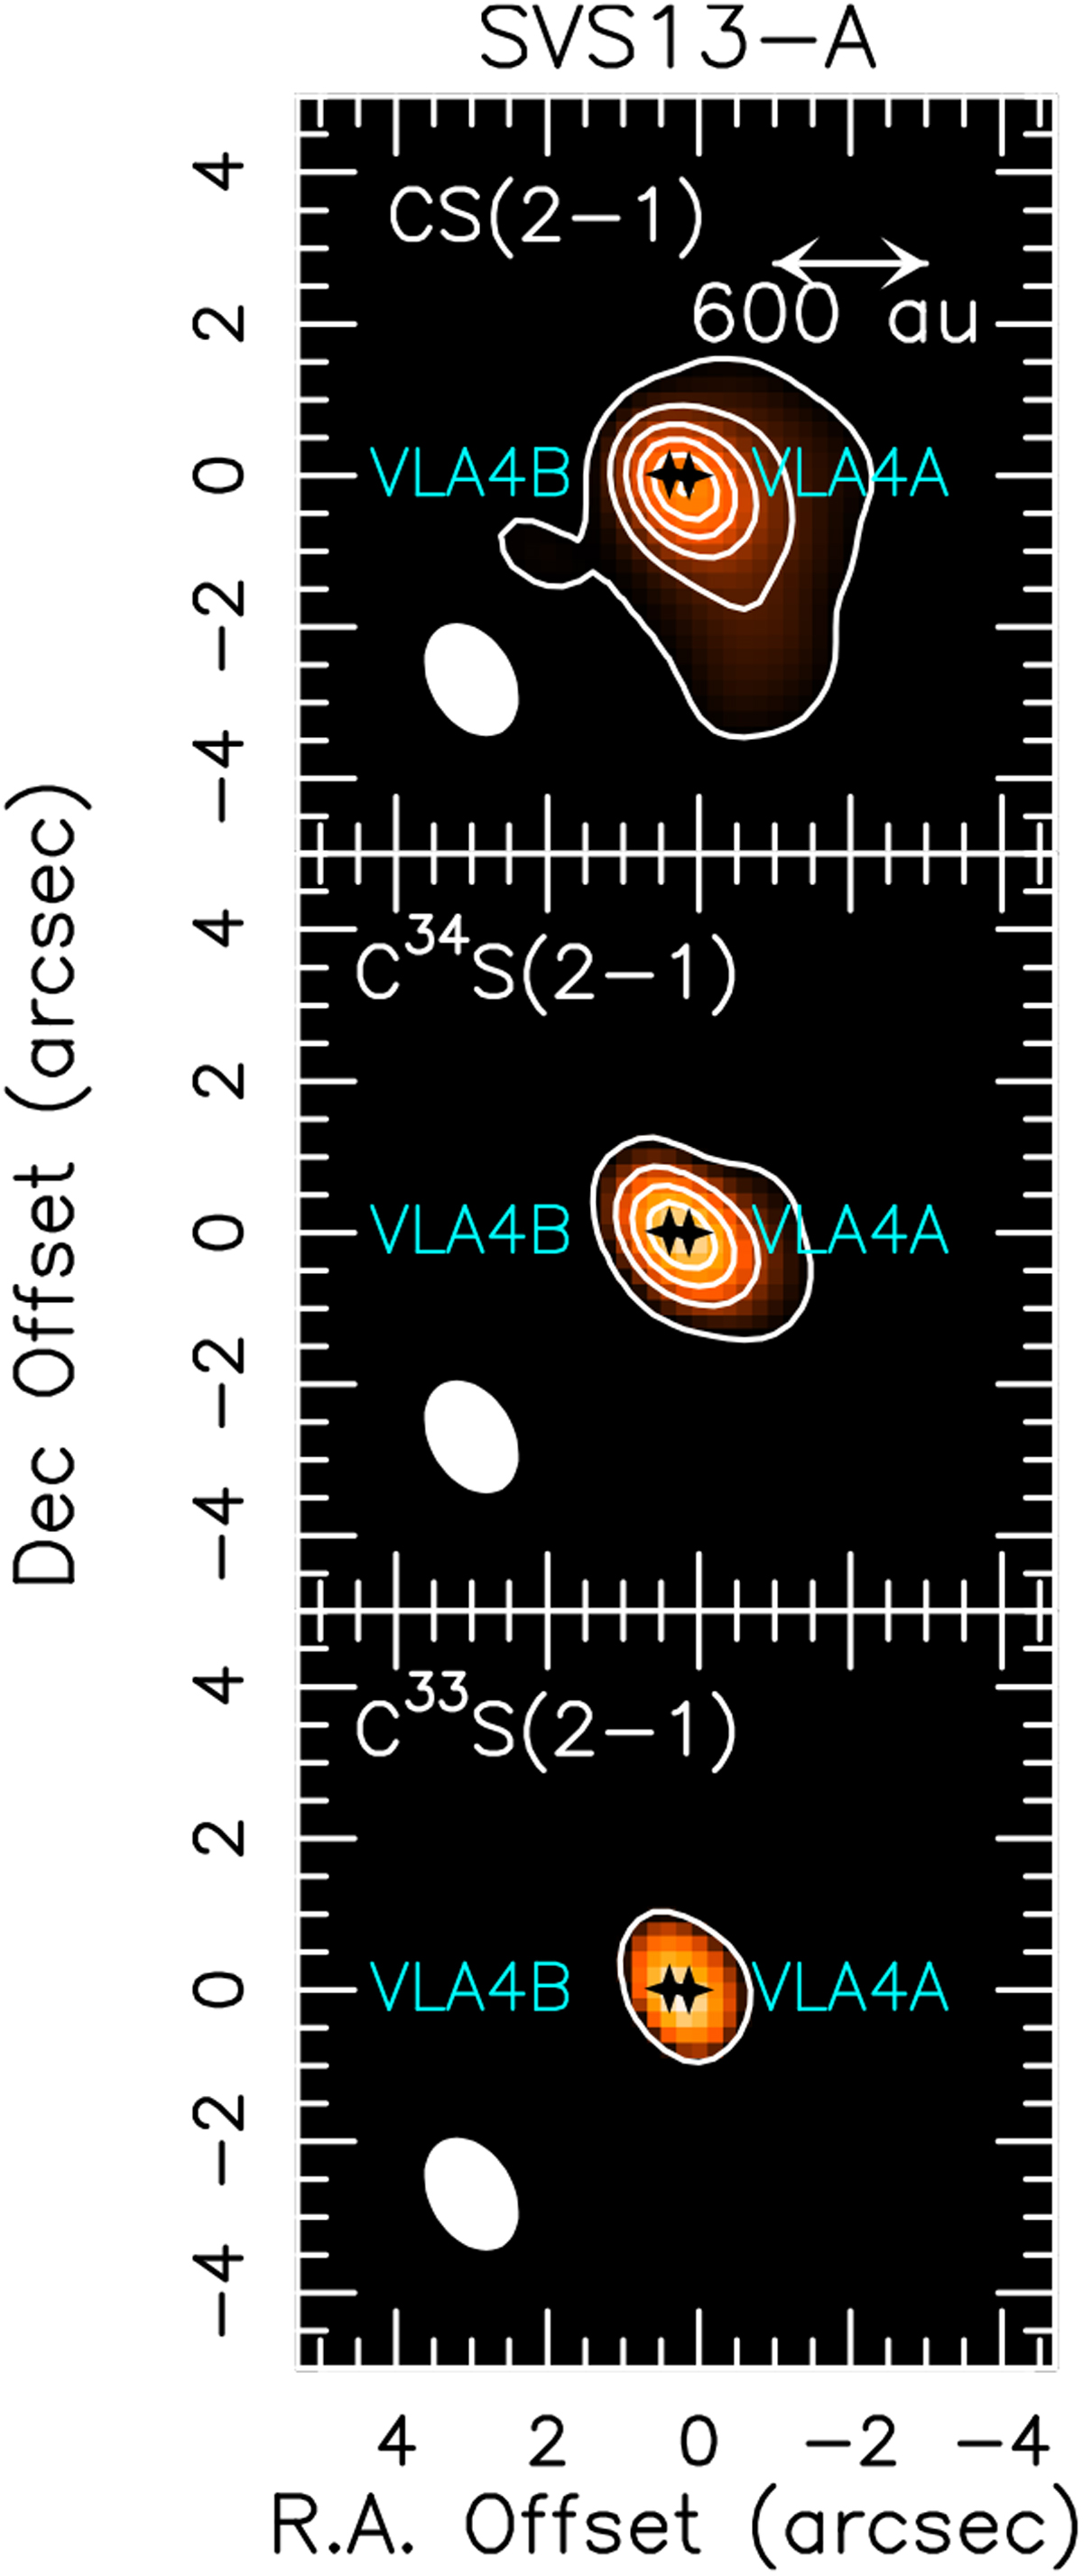
Fig. 4
Download original image
Spatial distribution of the SVS13-A region obtained using the J = 2–1 CS (upper panel), C34S (middle), and C33S (bottom) line emission (contours and colour). The whole velocity emitting region has been used (down to –5 km s−1 and up to +25 km s−1, depending on the line, see Fig. 5). Angular offset are respect to the phase centre (see Sect. 3). First contour and steps are 5σ and 10σ, respectively. The 1σ value is 10 mJy km s−1 (CS), and 4 mJy km s−1 (C34 S, C33 S). The filled ellipse shows the synthesized beam (HPBW): 1.′′6 × 1.′′1 (PA = 41°). The black crosses indicate the positions of the VLA4A and VLA4B sources as imaged using the VLA array by Tobin et al. (2018).
Current usage metrics show cumulative count of Article Views (full-text article views including HTML views, PDF and ePub downloads, according to the available data) and Abstracts Views on Vision4Press platform.
Data correspond to usage on the plateform after 2015. The current usage metrics is available 48-96 hours after online publication and is updated daily on week days.
Initial download of the metrics may take a while.