Fig. A.3
Download original image
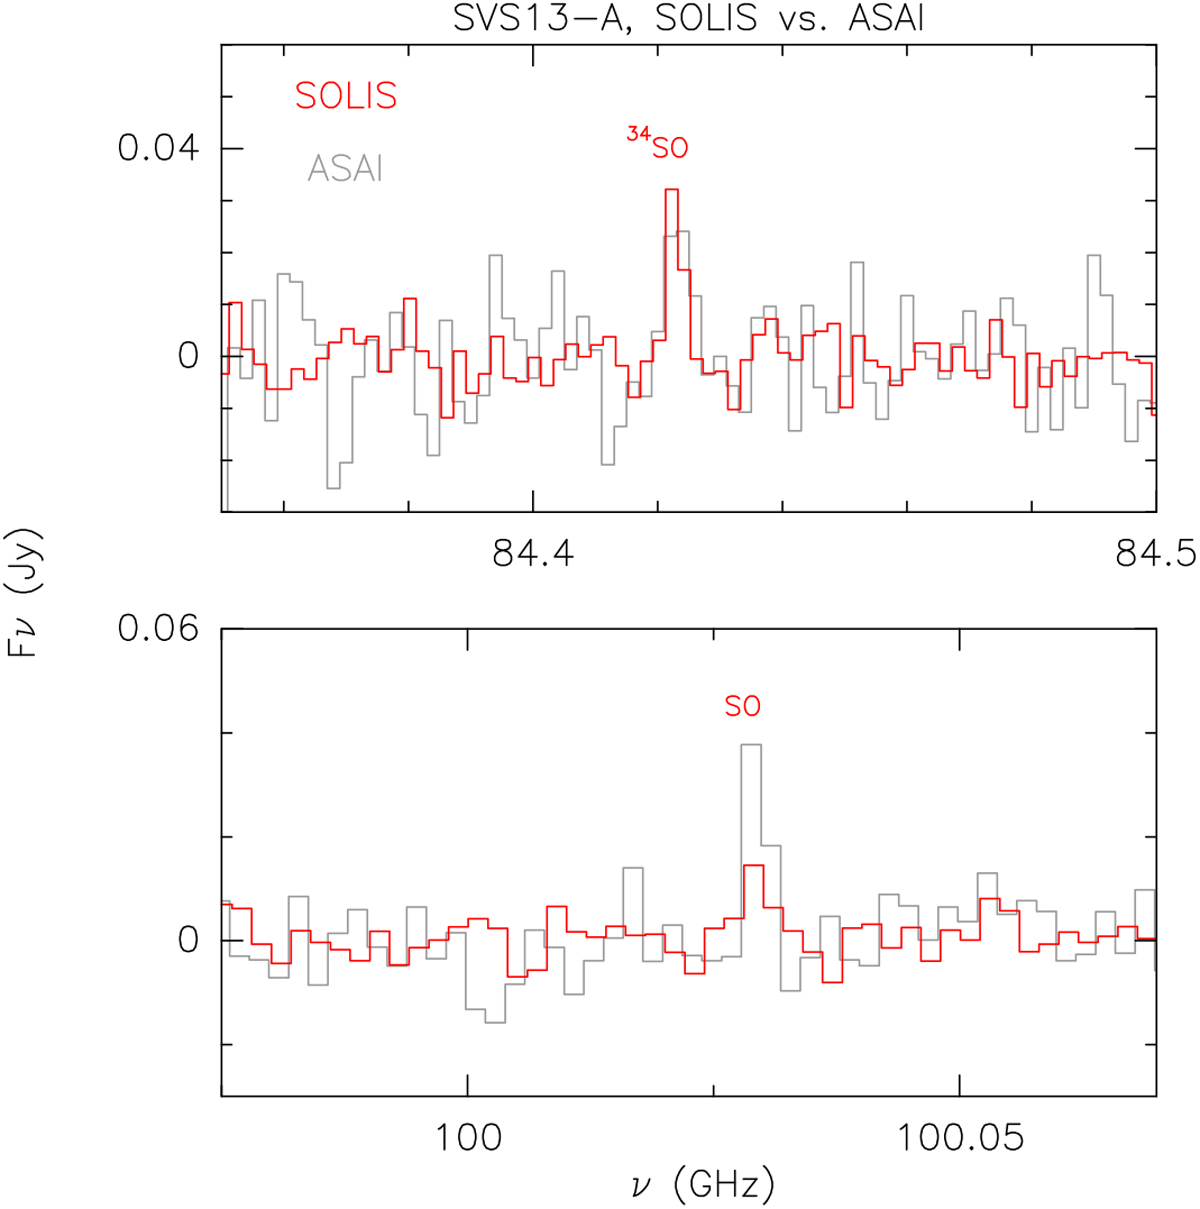
Zoom-in of Fig. A.1 to enlight selected emission lines of S-bearing species: Comparison (in flux density scale) of the 3mm spectrum as observed using the IRAM 30-m antenna (grey; in the ASAI LP context Lefloch et al. (2018)) and that extracted from the present NOEMA SOLIS maps (red) from a circular region equal to the IRAM 30-m HPBW (25′′ at 100 GHz, 29′′ at 84 GHz). The ASAI spectrum has been smoothed to match the SOLIS velocity resolution (2 MHz, see Sect. 3). Red labels indicate the S-bearing species analyzed in this paper (see Table 1).
Current usage metrics show cumulative count of Article Views (full-text article views including HTML views, PDF and ePub downloads, according to the available data) and Abstracts Views on Vision4Press platform.
Data correspond to usage on the plateform after 2015. The current usage metrics is available 48-96 hours after online publication and is updated daily on week days.
Initial download of the metrics may take a while.