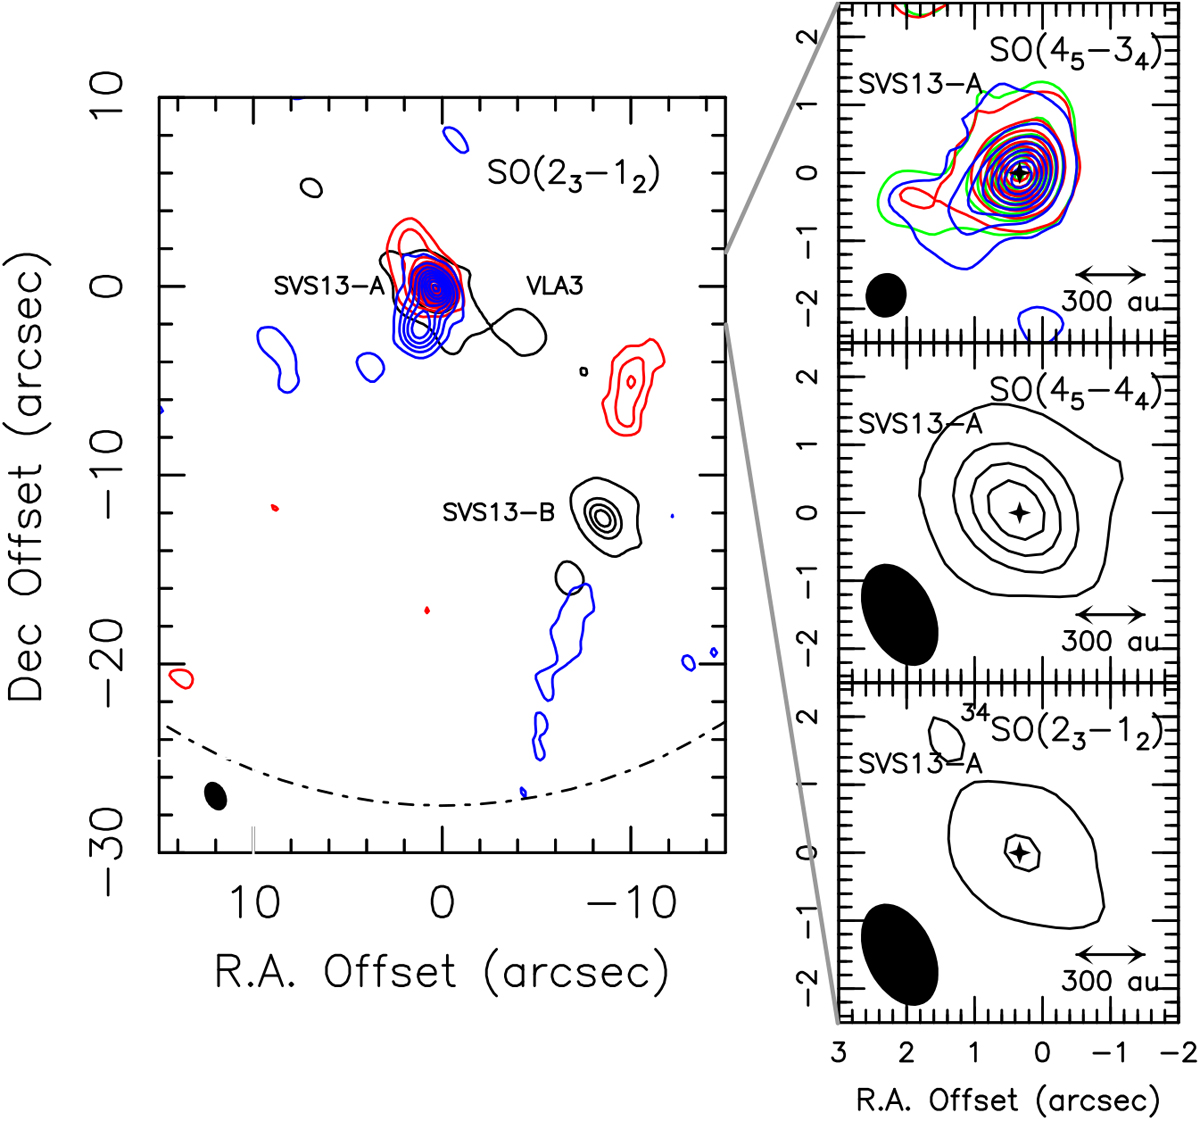
Fig. 2
Download original image
SVS13-A region as imaged using SO. Left panel: spatial distribution of the SO(23 –12) red- and blue-shifted emission overlaid with the 90 GHz continuum map (see Fig. 1). Red-shifted emission maps have been derived by integrating the SO emission from the systemic velocity (+8.6 km s−1, Chen et al. 2009) up to +20 km s−1. Blue-shifted image has been obtained by integrating down to –94 km s−1 in absolute values). Angular offset are with respect to the phase centre (see Sect. 3). First contour and steps are 3σ and 4σ, respectively. The 1σ value is 5 mJy km s−1 and 14 mJy km s−1 for the red- and blue-shifted emission, respectively. The filled ellipse shows the synthesized beam (HPBW): 1.′′ 6 × 1.′′1 (PA = 41°). The SVS13-B protostar is also labelled. White dashed circle indicate the primary beam: ~ 55′′. Upper-right panel: zoom-in of the inner SVS13-A region as observed using the SO(45 –34) emission. Green contours are for the emission in the 3 km s−1 around the systemic velocity. Red-shifted emission maps has been derived by integrating the SO emission from the systemic velocity up to +20 km s−1. Blue-shifted image has been obtained by integrating down to –5 km s−1. First contour and steps are 3σ and 10σ, respectively. The 1σ values are 10 mJy km s−1 (systemic velocity), 13 mJy km s−1 (red), and 11mJy km s−1 (blue). Symbols are as in the left panel. The black cross indicates the positions of the 205 GHz continuum peak (see Fig. 1). The synthesized beam (HPBW) is 0.′′ 65 × 0.′′58 (PA = –46°). Middle-right panel: zoom-in of the inner SVS13-A region as observed using the SO(45 –44) emission. The whole velocity emitting region has been used (see Fig. 3). First contour and steps are 3σ (9 mJy km s−1) and 10σ, respectively. Symbols are as in the left panel. The synthesized beam (HPBW) is: 1.′′ 6 × 1.′′1 (PA= 41°). Bottom-right panel: zoom-in on the inner SVS13-A region as observed using the 34SO(23–12) emission. First contour and steps are3σ (12 mJy km s−1) and 10σ, respectively. Symbols are as in the left panel. The synthesized beam is the same as in the middle-right panel.
Current usage metrics show cumulative count of Article Views (full-text article views including HTML views, PDF and ePub downloads, according to the available data) and Abstracts Views on Vision4Press platform.
Data correspond to usage on the plateform after 2015. The current usage metrics is available 48-96 hours after online publication and is updated daily on week days.
Initial download of the metrics may take a while.