Free Access
Fig. 13
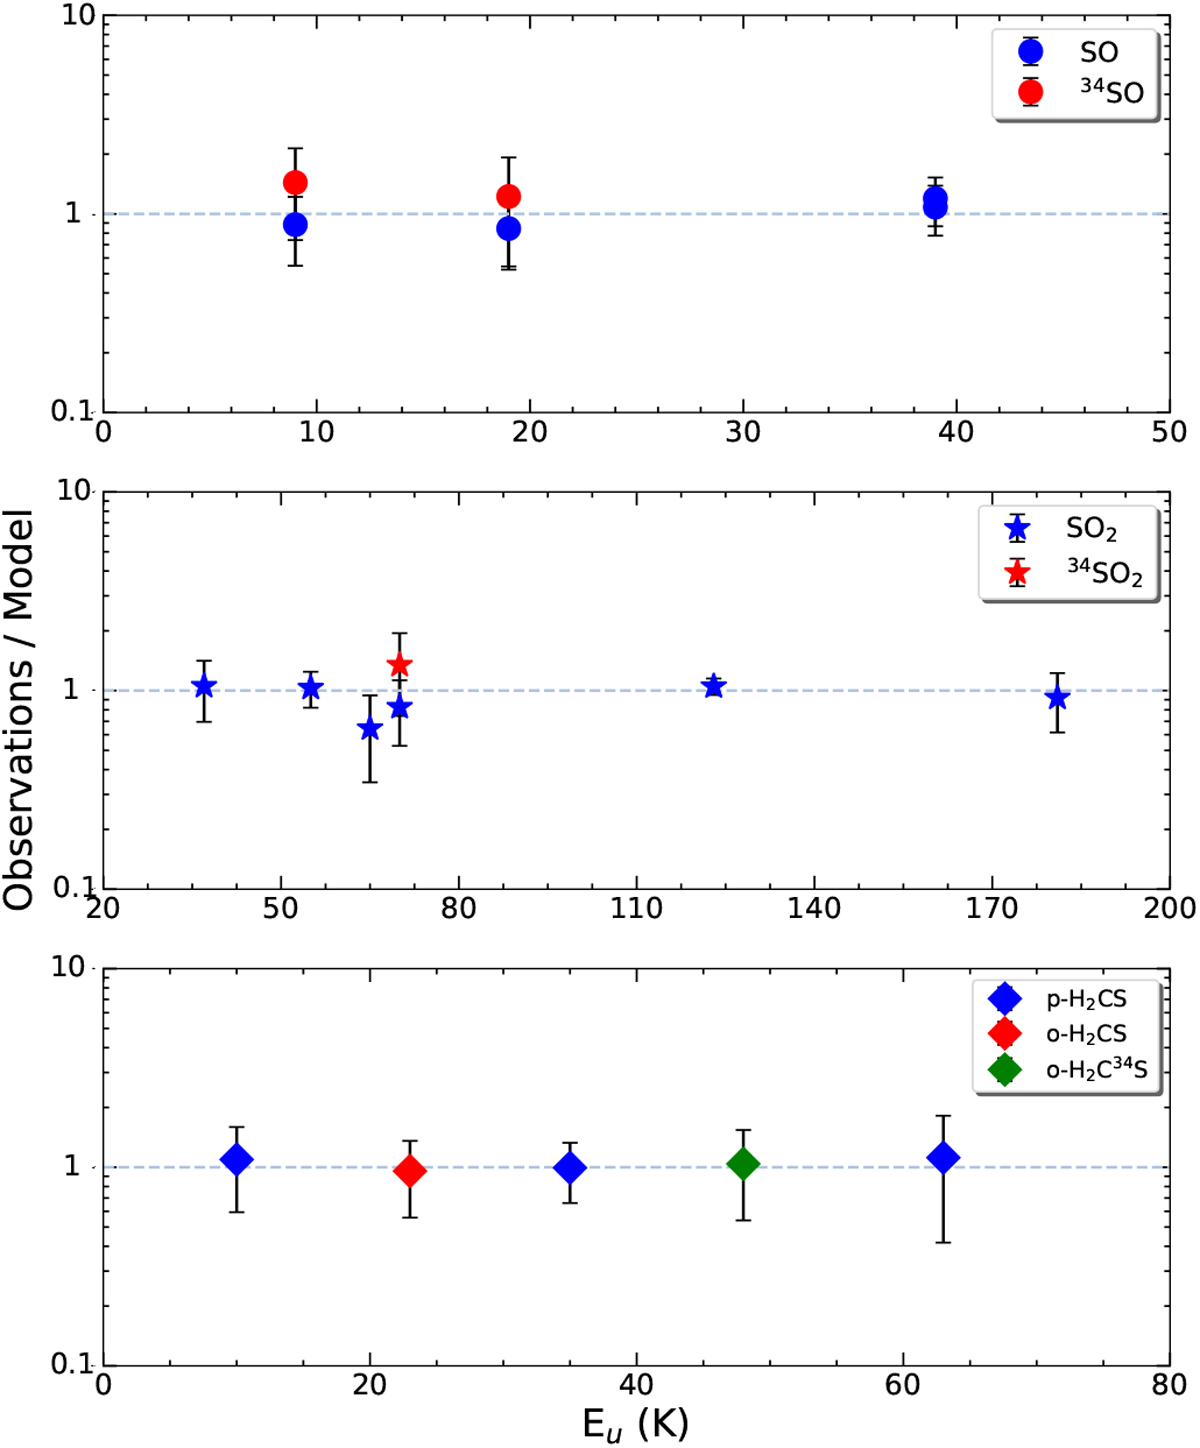
Download original image
Ratio of the observed and best-fit theoretical line integrated intensities of SO (upper panel), SO2 (middle), and H2CS (bottom) asa function of the line upper-level energy (see the text and Table 2). Different symbols indicate different isotopologues as well as ortho and para species.
Current usage metrics show cumulative count of Article Views (full-text article views including HTML views, PDF and ePub downloads, according to the available data) and Abstracts Views on Vision4Press platform.
Data correspond to usage on the plateform after 2015. The current usage metrics is available 48-96 hours after online publication and is updated daily on week days.
Initial download of the metrics may take a while.