Fig. 11
Download original image
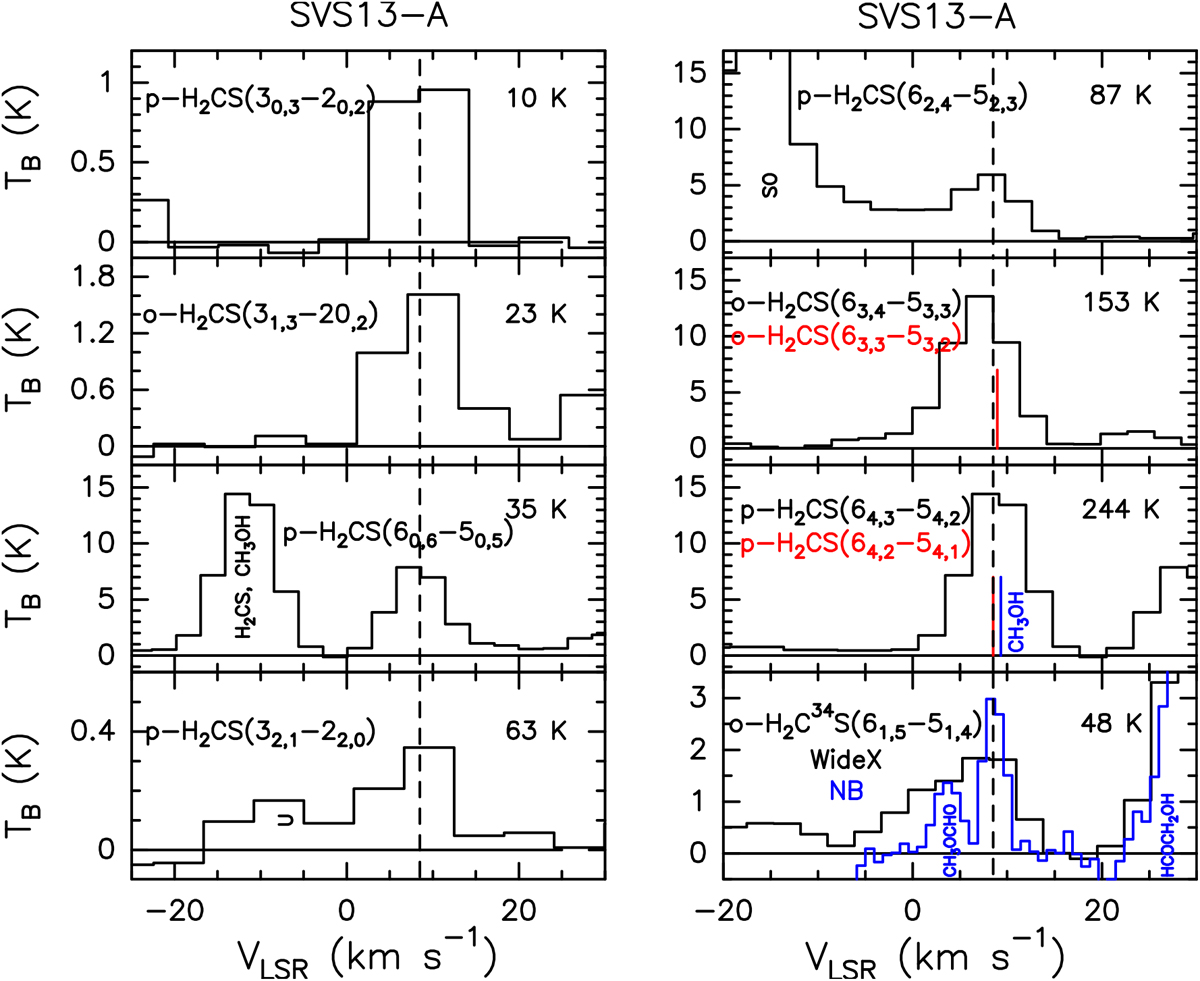
Observed H2CS, and H2C34S spectra (in TB scale, see Table 1) extracted at the emission peak: α2000 = 03h29m03.s75, δ2000 = +31°16′03.′′8. Transitions and corresponding upper level energies are reported. The vertical dashed line stands for the ambient LSR velocity (+8.6 km s−1, Chen et al. 2009). Red labels and red vertical segments denote two H2CS profiles with the same Eu value and blended at the present spectral resolution (Table 1). The black vertical labels indicate that the line is reported in another panel of the present figure. The H2CS doublets at Eu = 244 K could be contaminated by CH3OH emission with Eu = 317 K (see Table 1). The H2C34S(61,5–51,4) profile has been observed using both low- (black histogram) and high-spectral (blue) backends (see Sect. 2: labelled Widex and NB, respectively).
Current usage metrics show cumulative count of Article Views (full-text article views including HTML views, PDF and ePub downloads, according to the available data) and Abstracts Views on Vision4Press platform.
Data correspond to usage on the plateform after 2015. The current usage metrics is available 48-96 hours after online publication and is updated daily on week days.
Initial download of the metrics may take a while.