Fig. 1
Download original image
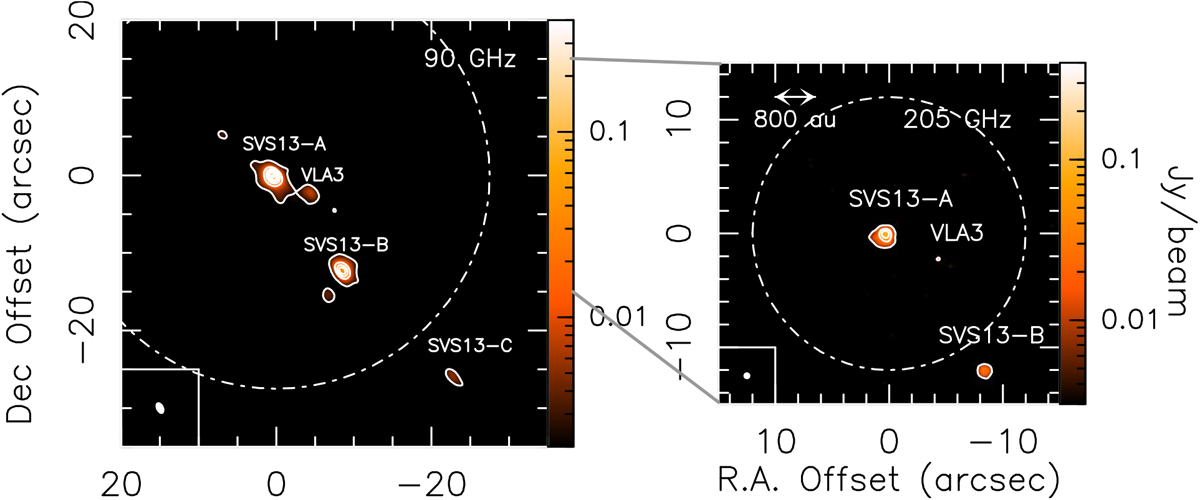
SVS13-A region as observed in dust continuum emission using IRAM NOEMA. Left panel: image at 3 mm (see Sect. 2). Angular offset are with respect to the phase center (see Sect. 3). First contour and steps are 5σ (1σ = 100μJy) and 50σ, respectively. The filled ellipse shows the synthesized beam (HPBW): 1.′′6 × 1.′′1 (PA = 41°). The SVS13-B, SVS13-C, and VLA3 protostars are also labelled. White dashed circle indicate the primary beam: ~55′′. Right panel:zoom-in of the inner SVS13-A region as observed in dust continuum at 1.3 mm. First contour and steps are 5σ (1σ = 1 mJy) and 30σ, respectively. Symbols are as in the left panel. The synthesized beam (HPBW) is 0.′′ 6 × 0.′′6 (PA = –46°), while the primary beam is 24′′.
Current usage metrics show cumulative count of Article Views (full-text article views including HTML views, PDF and ePub downloads, according to the available data) and Abstracts Views on Vision4Press platform.
Data correspond to usage on the plateform after 2015. The current usage metrics is available 48-96 hours after online publication and is updated daily on week days.
Initial download of the metrics may take a while.