Fig. 4.
Download original image
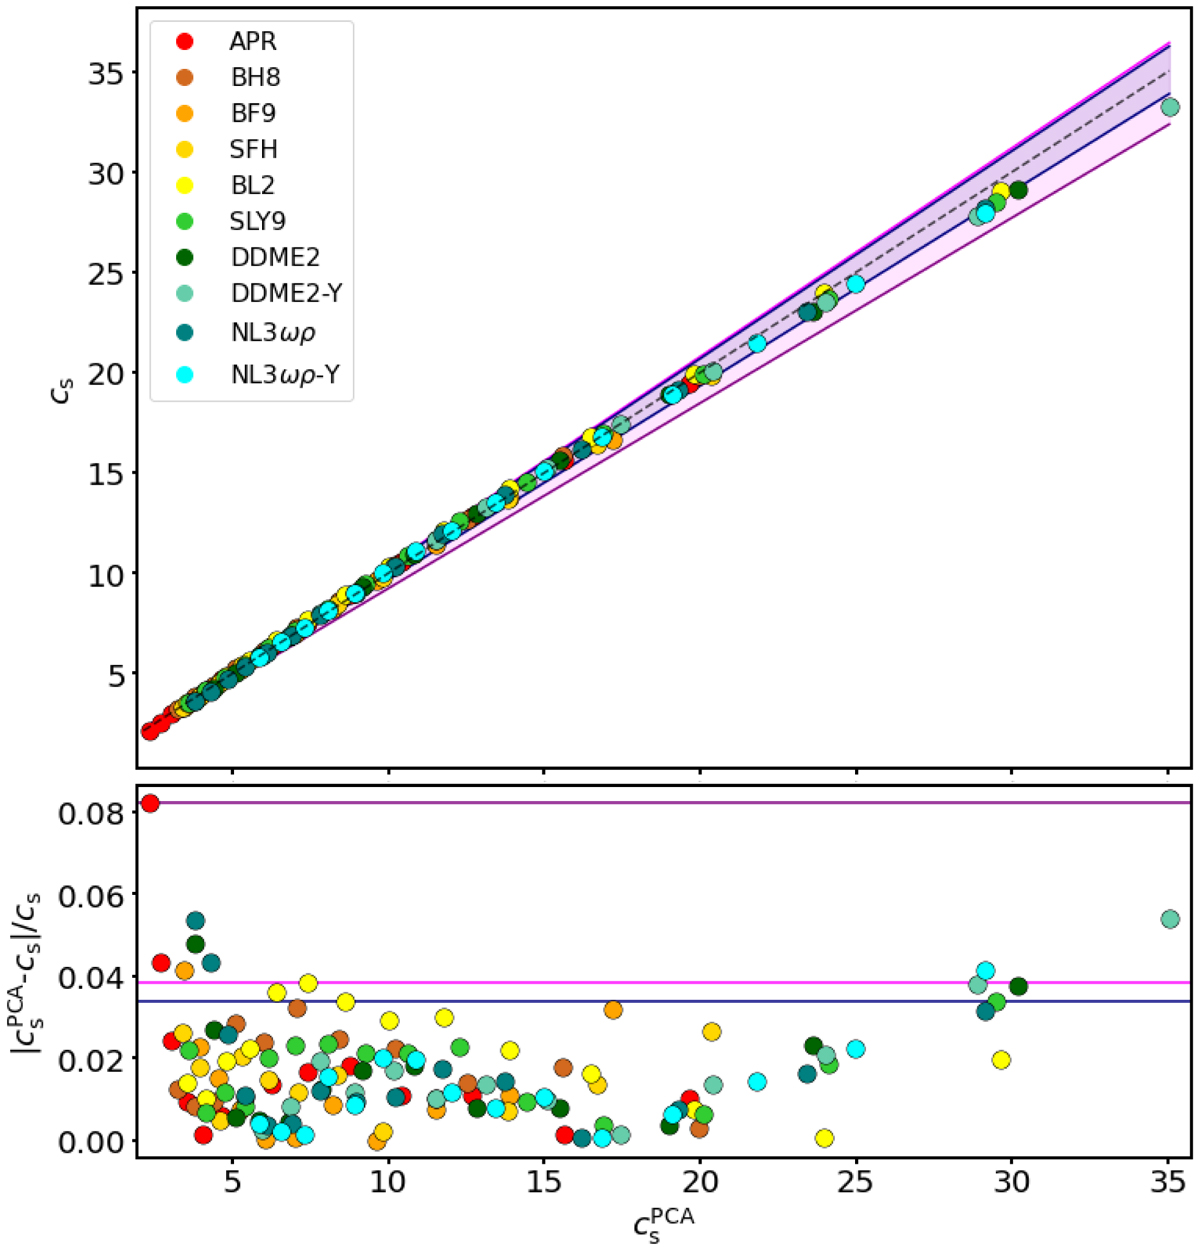
Distortion coefficient cs, calculated according to Eq. (14) in GR, versus its approximation ![]() calculated with the quasi-universal relation in Eq. (15) (top plot). The corresponding relative deviation from the PCA is given in the bottom plot. The dashed line is
calculated with the quasi-universal relation in Eq. (15) (top plot). The corresponding relative deviation from the PCA is given in the bottom plot. The dashed line is ![]() . The magenta shaded area comprises all data points and the purple and magenta lines represent the upper and lower bounds of Eq. (15). The dark blue lines bounding the shaded blue area mark the 90th percentile error region. The EoS are colour-coded, and ordered in the legend, according to the compactness C = Mk/Rc calculated at Mk = 1.4 M⊙ in GR: red for the highest compactness and blue for the lowest compactness.
. The magenta shaded area comprises all data points and the purple and magenta lines represent the upper and lower bounds of Eq. (15). The dark blue lines bounding the shaded blue area mark the 90th percentile error region. The EoS are colour-coded, and ordered in the legend, according to the compactness C = Mk/Rc calculated at Mk = 1.4 M⊙ in GR: red for the highest compactness and blue for the lowest compactness.
Current usage metrics show cumulative count of Article Views (full-text article views including HTML views, PDF and ePub downloads, according to the available data) and Abstracts Views on Vision4Press platform.
Data correspond to usage on the plateform after 2015. The current usage metrics is available 48-96 hours after online publication and is updated daily on week days.
Initial download of the metrics may take a while.