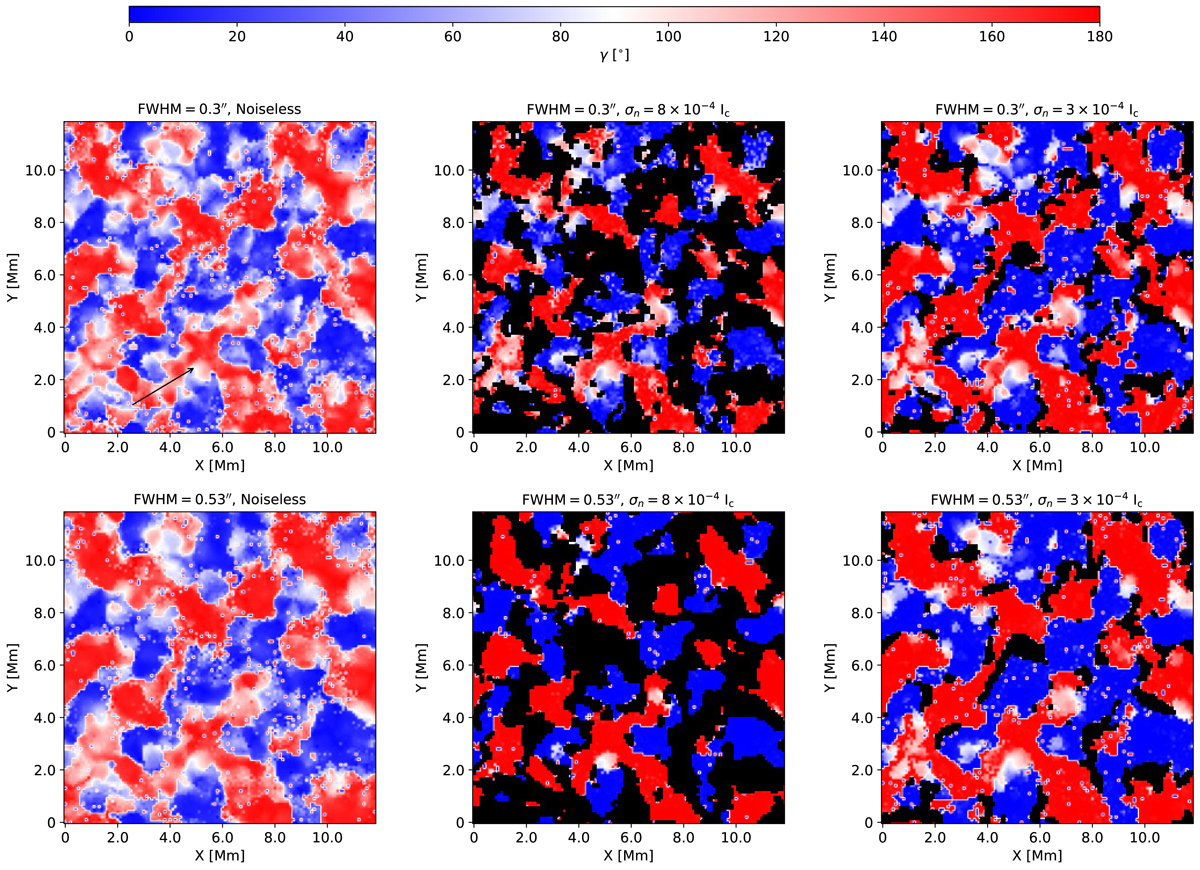
Fig. 9.
Download original image
Maps of inclinations returned from S1 inversions for the spatially and spectrally degraded synthetic profiles, with no noise (left) and two different noise levels (8 × 10⁻⁴Ic, middle, and 3 × 10⁻⁴Ic, right). Only Stokes vectors with a maximum amplitude > 3σn are retained after PCA. Black areas are representative of pixels which do not reach this threshold. The lower row shows the maps for V1 (FWHM = 0.53″) while the upper row shows the same for V3 (FWHM = 0.3″, with stray light included in the estimation and application of spatial PSF). The arrow in the upper left panel indicates the spatial location of the sample profile shown in Fig. 11.
Current usage metrics show cumulative count of Article Views (full-text article views including HTML views, PDF and ePub downloads, according to the available data) and Abstracts Views on Vision4Press platform.
Data correspond to usage on the plateform after 2015. The current usage metrics is available 48-96 hours after online publication and is updated daily on week days.
Initial download of the metrics may take a while.