Fig. 8.
Download original image
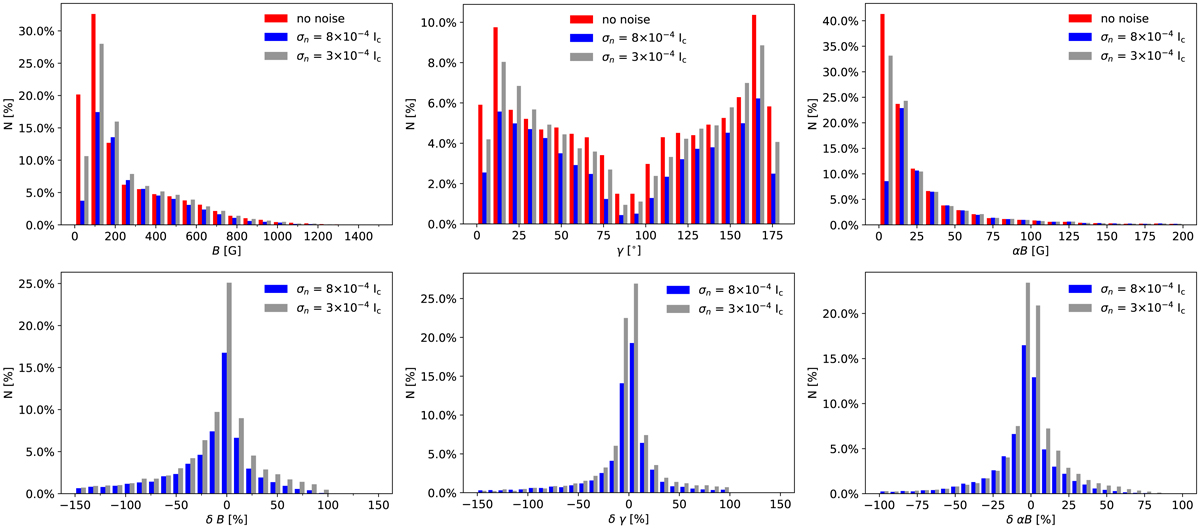
Distributions of B (left), γ (middle), and αB (right) returned from the inversions under S1 at GREGOR resolutions (V3). The inversions were run without the addition of noise (red), and then repeated with noise levels of 8 × 10⁻⁴Ic (blue) and 3 × 10⁻⁴Ic added (grey). The histograms of the inversions with noise are shown for pixels with maximum amplitude in at least one Stokes vector > 3σn. The lower row shows the difference between the values returned from inversions of the noiseless case and the values returned when noise is added. The percentages in all histograms are weighted with respect to the total number of pixels, i.e. including those with no polarization.
Current usage metrics show cumulative count of Article Views (full-text article views including HTML views, PDF and ePub downloads, according to the available data) and Abstracts Views on Vision4Press platform.
Data correspond to usage on the plateform after 2015. The current usage metrics is available 48-96 hours after online publication and is updated daily on week days.
Initial download of the metrics may take a while.