Fig. 7.
Download original image
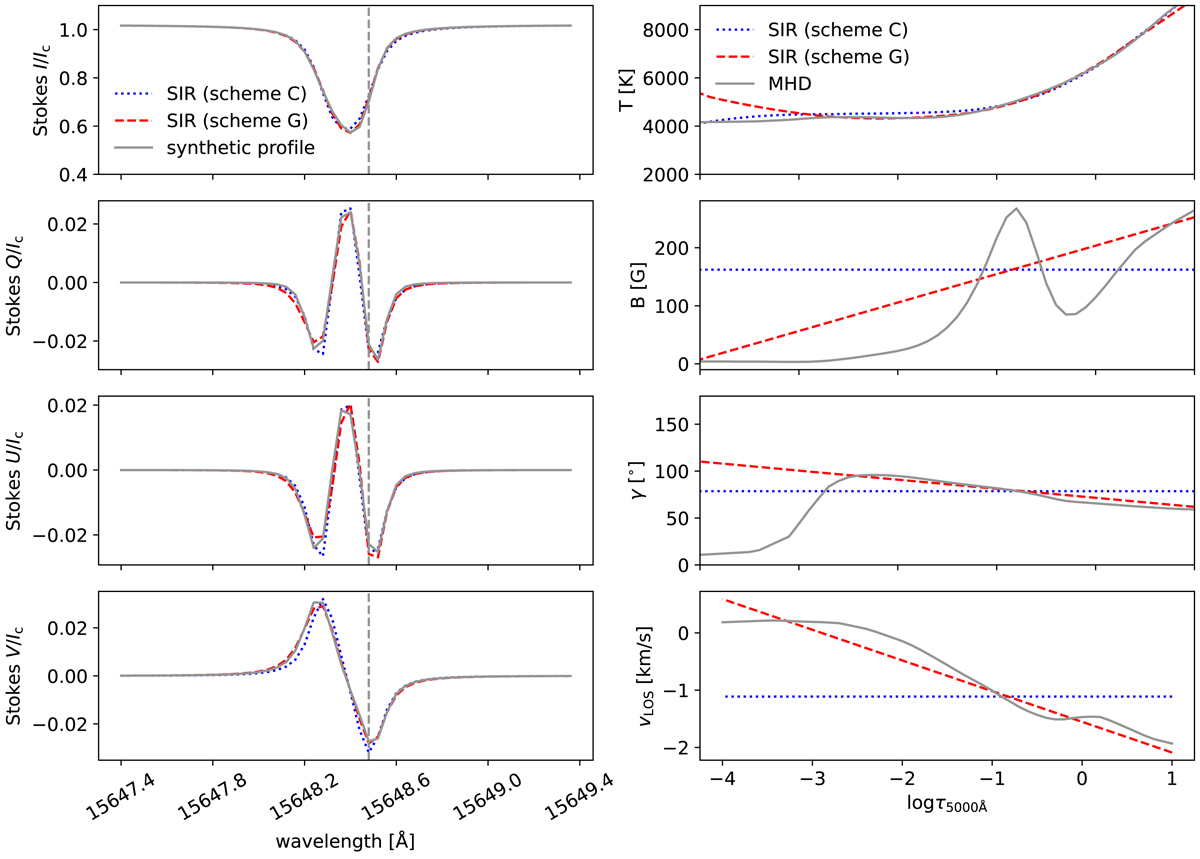
Sample synthetic profile with the inverted profiles and associated atmospheres. Stokes I, Q, U, and V (grey, solid lines) are shown for the 15 648.52 Å line (left panels), normalised by the average continuum intensity, along with the inverted profiles from scheme C (blue, dotted) and G (red, dashed) lines. The dashed, grey line shows the rest wavelength. The retrieved atmospheric parameters (namely T, B, γ, and vLOS) are shown as a function of log τ5000 Å (right panels). The stratification of the atmospheric parameters in the MHD model is also shown (grey, solid line).
Current usage metrics show cumulative count of Article Views (full-text article views including HTML views, PDF and ePub downloads, according to the available data) and Abstracts Views on Vision4Press platform.
Data correspond to usage on the plateform after 2015. The current usage metrics is available 48-96 hours after online publication and is updated daily on week days.
Initial download of the metrics may take a while.