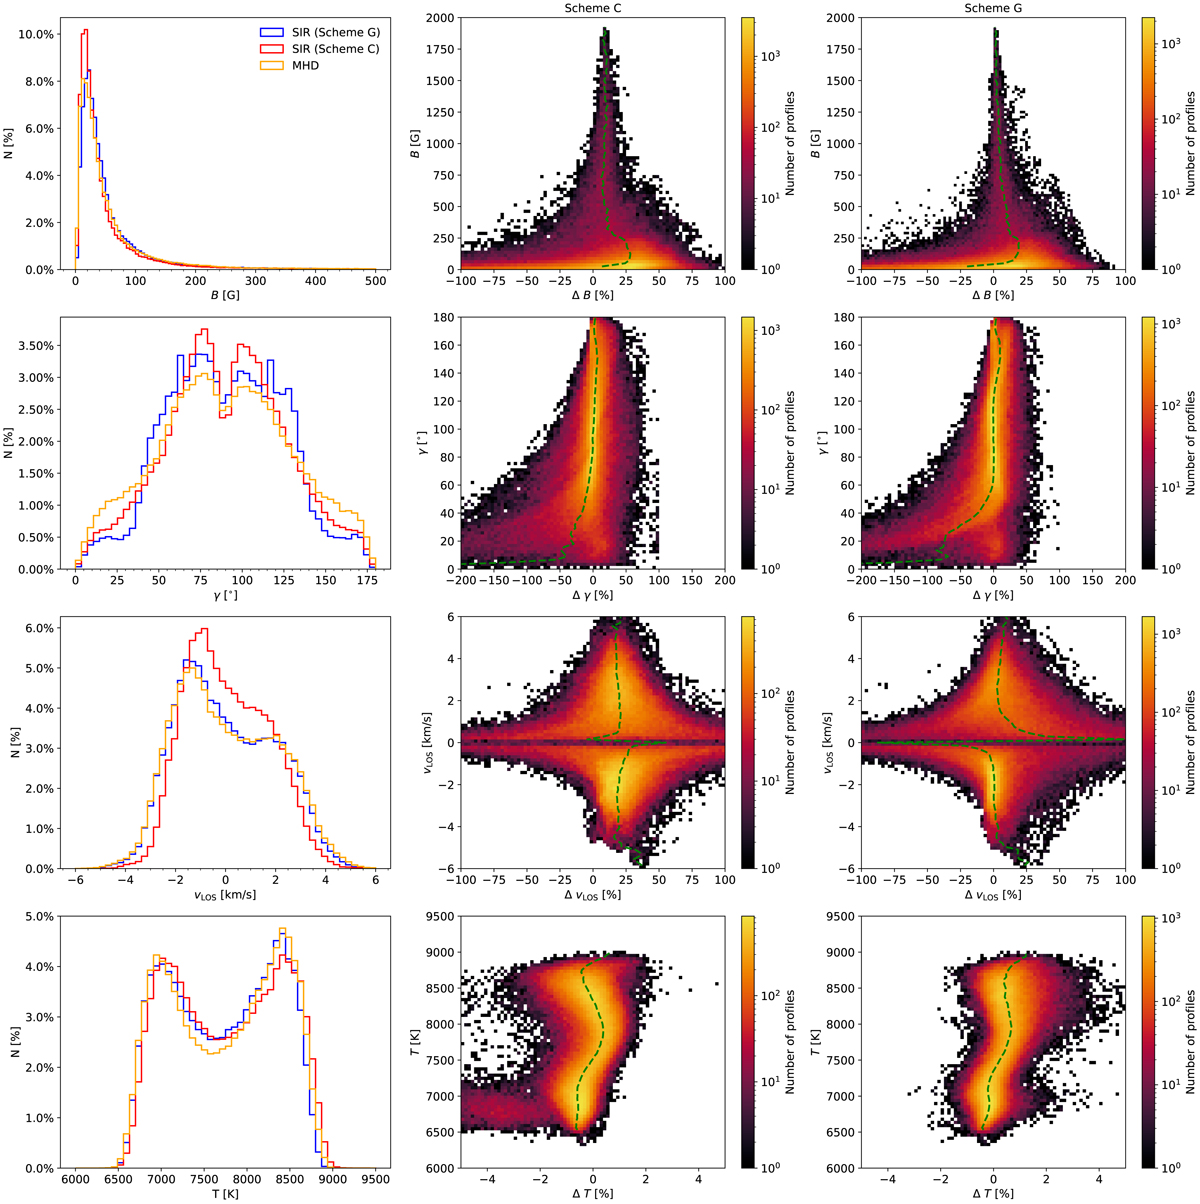
Fig. 4.
Download original image
Distributions of values (left) and histograms between the ‘true’ MHD values and the differences between ‘true’ MHD and inverted values (middle and right, for scheme C and G, respectively) in B, γ, vLOS, and T (upper to lower row, respectively). Values are retrieved at log τ5000 Å = −0.5, except for T which is retrieved at log τ5000 Å = 0.5. In the distributions, values from the MHD cube (orange lines) and returned from the inversions under scheme C (red lines) and G (blue lines) are shown. The histograms of B, γ, ΔB, and Δγ are shown for pixels with maximum amplitude in at least one polarized Stokes vector > 2.4 × 10⁻³Ic. The median error as a function of each parameter is shown by the green, dashed lines. The percentages in all histograms are weighted with respect to the total number of pixels, N, i.e. including those with no polarization. The colour scale is shown on a log10 scale.
Current usage metrics show cumulative count of Article Views (full-text article views including HTML views, PDF and ePub downloads, according to the available data) and Abstracts Views on Vision4Press platform.
Data correspond to usage on the plateform after 2015. The current usage metrics is available 48-96 hours after online publication and is updated daily on week days.
Initial download of the metrics may take a while.