Fig. 3.
Download original image
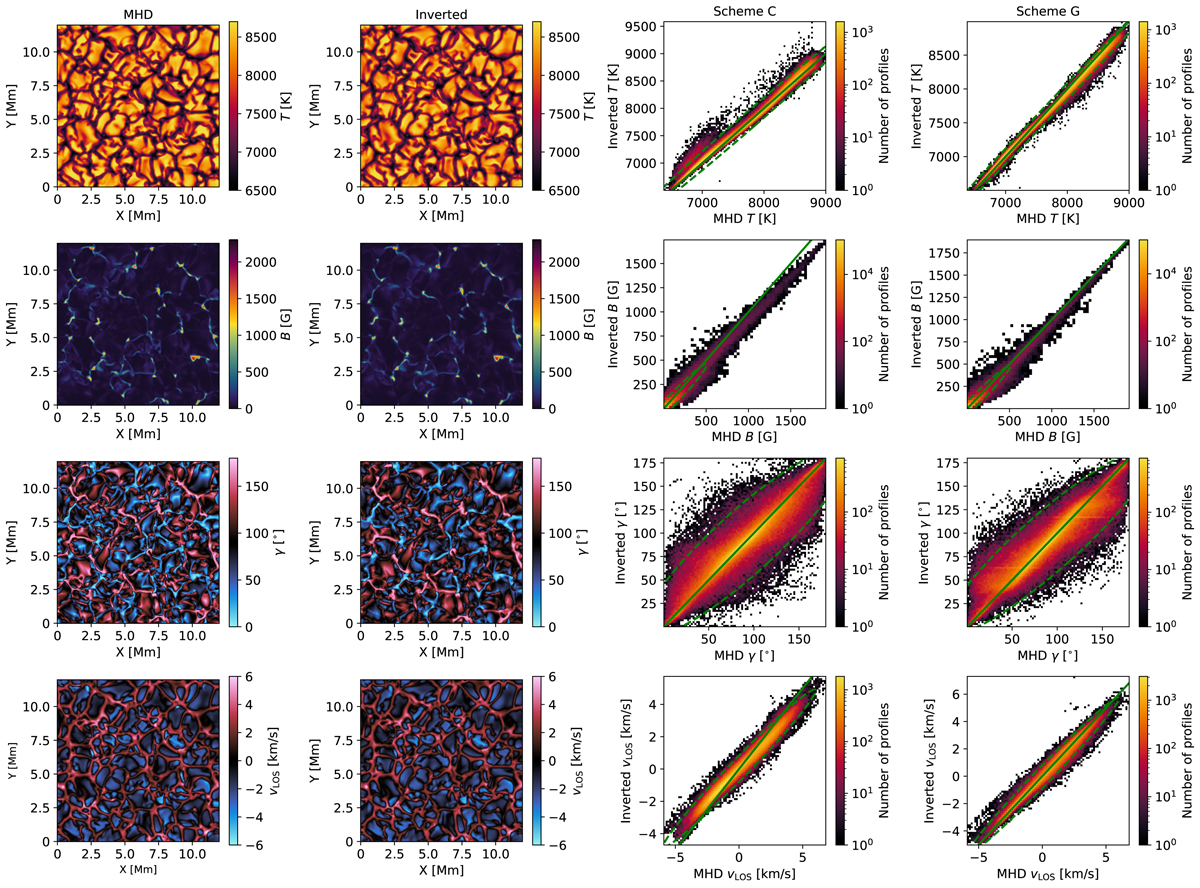
Comparison of the true MHD (first column) and inverted (second column) maps of the T (top row), B (second row), γ (third row), and vLOS (bottom row). The maps of inverted parameters are shown as determined by inversion scheme G (except for γ, which is shown as determined by scheme C). The colour table for B is extended higher than the maximum value (1915 G) to accommodate those with colour vision deficiency. The MHD and inverted parameters, for both scheme C (third column) and G (fourth column) are plotted against each other with the colour scale on a log10 scale. The solid, green line indicates the exact linear relationship. The dashed, green ellipse indicates the 99% confidence level. T is shown at log τ5000 Å = 0.5, while the other parameters are shown at log τ5000 Å = −0.5.
Current usage metrics show cumulative count of Article Views (full-text article views including HTML views, PDF and ePub downloads, according to the available data) and Abstracts Views on Vision4Press platform.
Data correspond to usage on the plateform after 2015. The current usage metrics is available 48-96 hours after online publication and is updated daily on week days.
Initial download of the metrics may take a while.