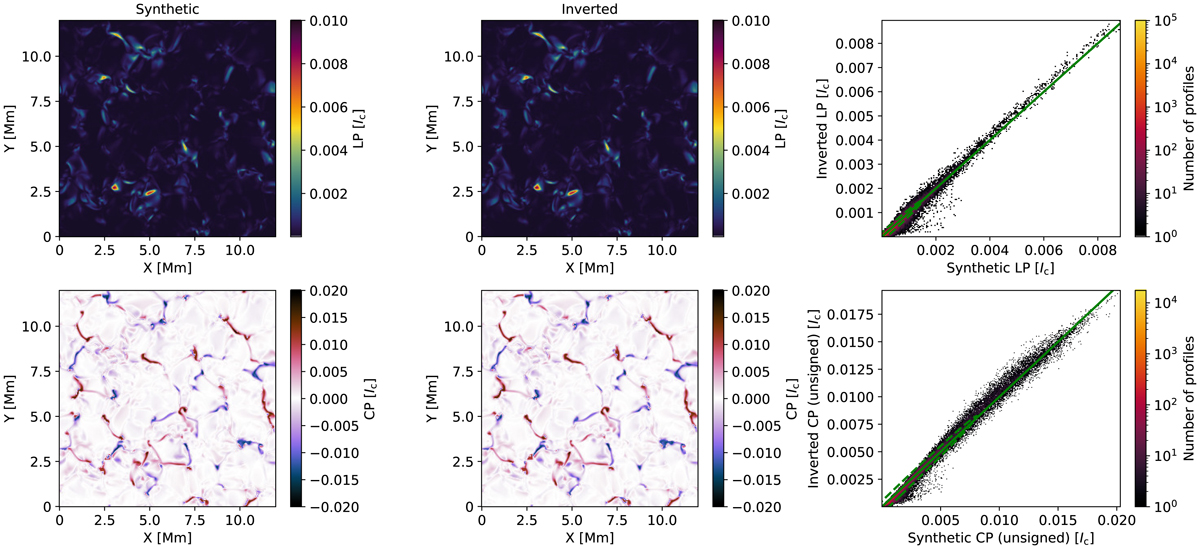
Fig. 2.
Download original image
Comparison of the synthesized (left) and inverted (middle) maps of the LP (upper row) and CP (lower row) according to scheme G. For both LP and CP the synthesized and inverted parameters are plotted against each other with the colour scale on a log10 scale (right). LP and CP, defined in Eqs. (4) and (5), respectively, are computed by integrating across the 15 648.52 Å line. The solid, green line indicates the exact linear relationship. The dashed, green ellipse indicates the 99% confidence level.
Current usage metrics show cumulative count of Article Views (full-text article views including HTML views, PDF and ePub downloads, according to the available data) and Abstracts Views on Vision4Press platform.
Data correspond to usage on the plateform after 2015. The current usage metrics is available 48-96 hours after online publication and is updated daily on week days.
Initial download of the metrics may take a while.