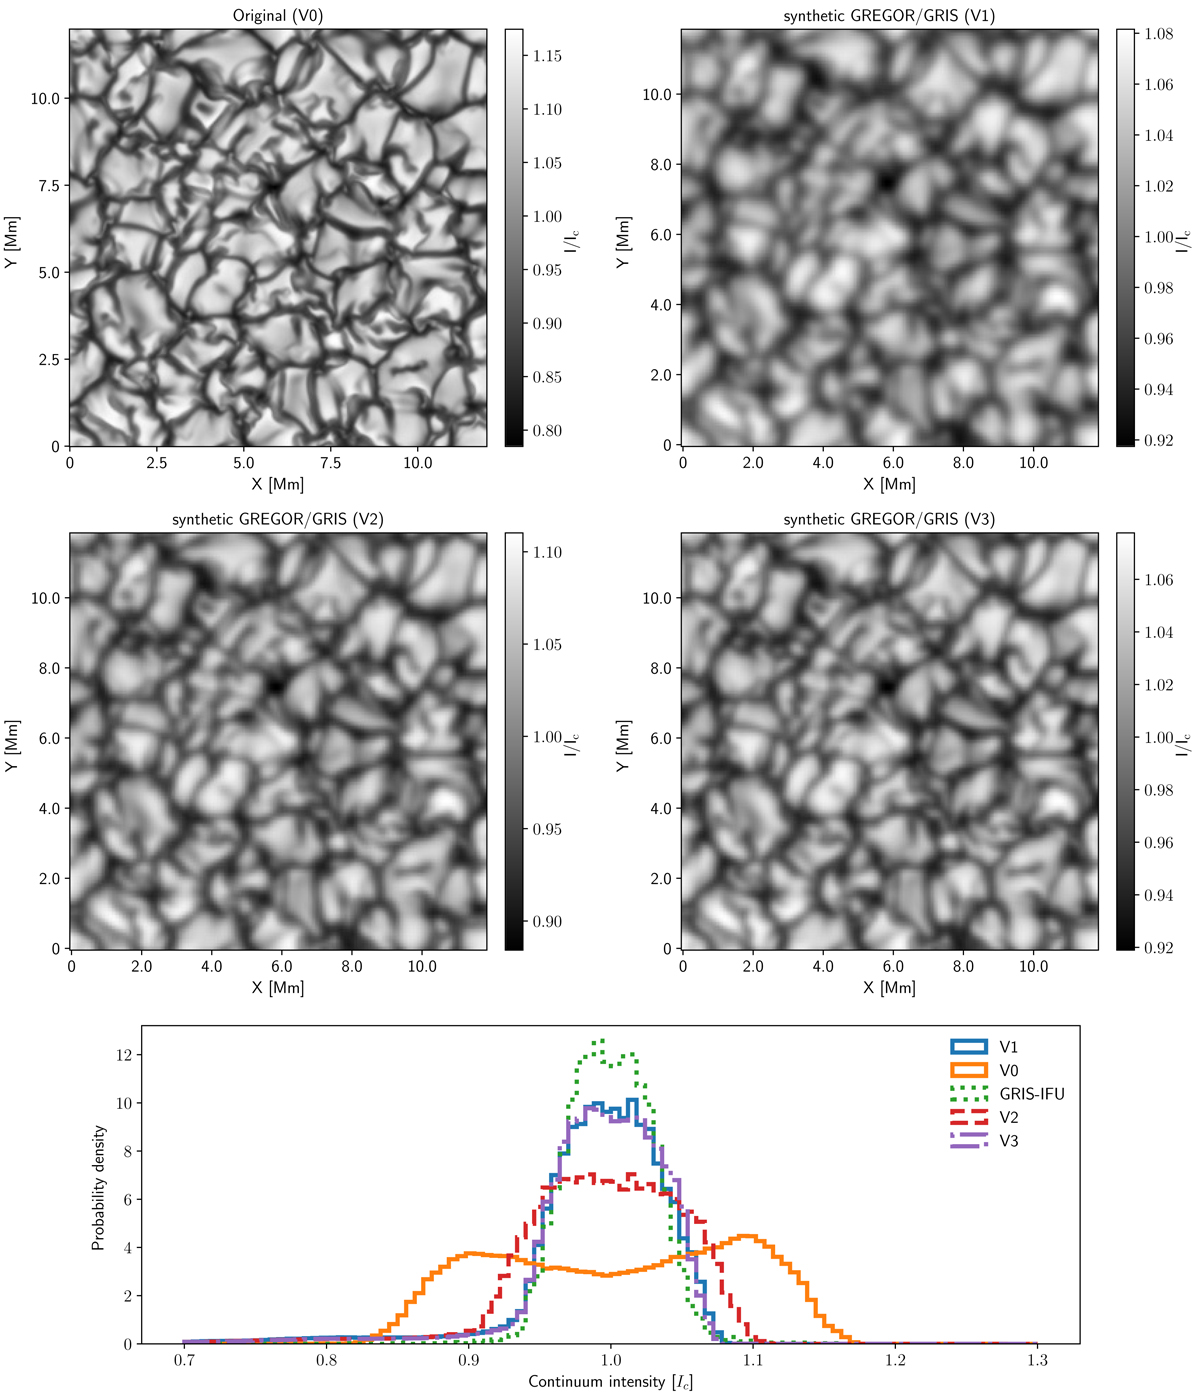
Fig. 1.
Download original image
Synthetic data produced from synthesis of MHD simulation outputs using SIR, shown at a continuum wavelength of 1565.47 nm. The top left panel shows the original Stokes I synthetic map (V0), while the top right and middle left panels show the spatially degraded map at an effective resolution of 380 km (V1) and 215 km (V2). The middle right panel shows the same as V2 but further degraded by stray light (V3). The bottom panel shows a histogram of the synthetic continuum intensities in each case, in addition to the distribution from real GREGOR/GRIS-IFU observations from 6 May 2019.
Current usage metrics show cumulative count of Article Views (full-text article views including HTML views, PDF and ePub downloads, according to the available data) and Abstracts Views on Vision4Press platform.
Data correspond to usage on the plateform after 2015. The current usage metrics is available 48-96 hours after online publication and is updated daily on week days.
Initial download of the metrics may take a while.