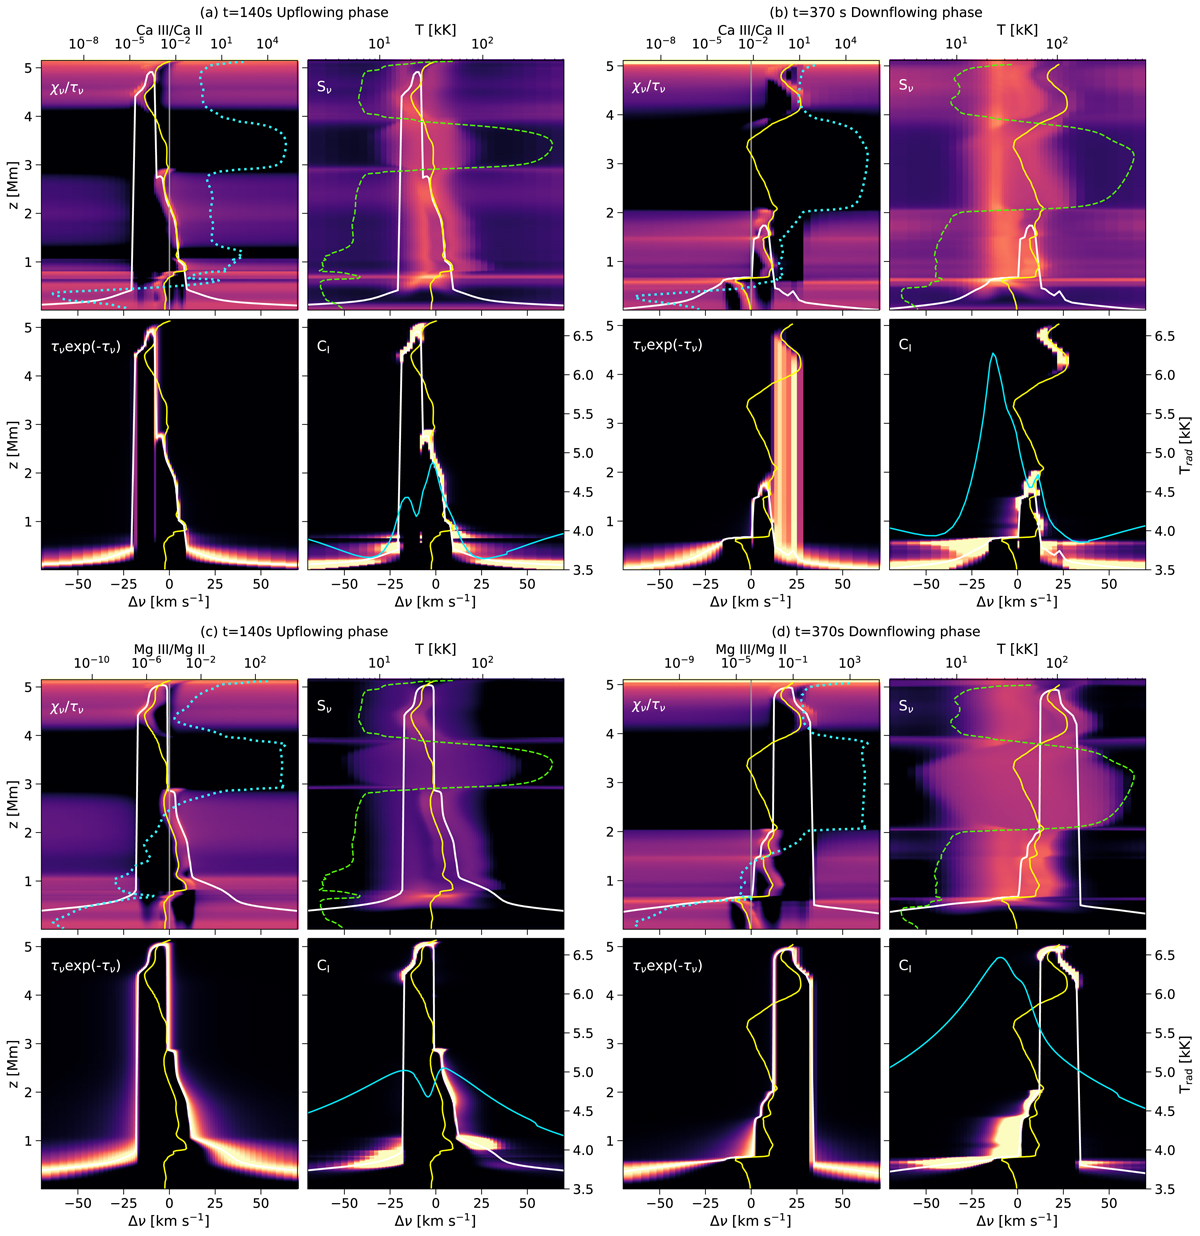
Fig. 9.
Download original image
Intensity formation breakdown figure for the Ca II K and Mg II k spectral lines corresponding to spicule 1 from the model atmospheres at the location indicated by the vertical marker in Fig. 7. Panel a: formation of the Ca II K spectral line at t = 140 s (upflowing phase). Panel b: formation of the Ca II K spectral line at t = 370 s (downflowing phase) with a strong asymmetry toward the redward side of the line center. Panel c: formation of the Mg II k line for the upflowing phase. Panel d: formation of a single peaked Mg II k spectral line for the downflowing phase. Each sub-panel shows (dark corresponds to low values and orange corresponds to high values) the quantity indicated at the top left corner as a function of geometric height z and frequency from the line center in km s−1. The τν = 1 curve (white) and vertical velocity (yellow, positive is downflow) are overplotted in each sub-panel. The solid gray line (indicating zero Doppler shift) is shown in the first sub-panels for reference. In addition, the first sub-panels show the ionization fraction (dotted cyan line) of Ca II (panels a and b) and Mg II (panels c and d) as a function of z. The upper right sub-panels also contain the plasma temperature (dashed green) as a function of z in logarithmic scale, specified along the top. The lower right panel also shows the specific intensity profiles (cyan) as radiation temperature with units specified on the right-hand side.
Current usage metrics show cumulative count of Article Views (full-text article views including HTML views, PDF and ePub downloads, according to the available data) and Abstracts Views on Vision4Press platform.
Data correspond to usage on the plateform after 2015. The current usage metrics is available 48-96 hours after online publication and is updated daily on week days.
Initial download of the metrics may take a while.