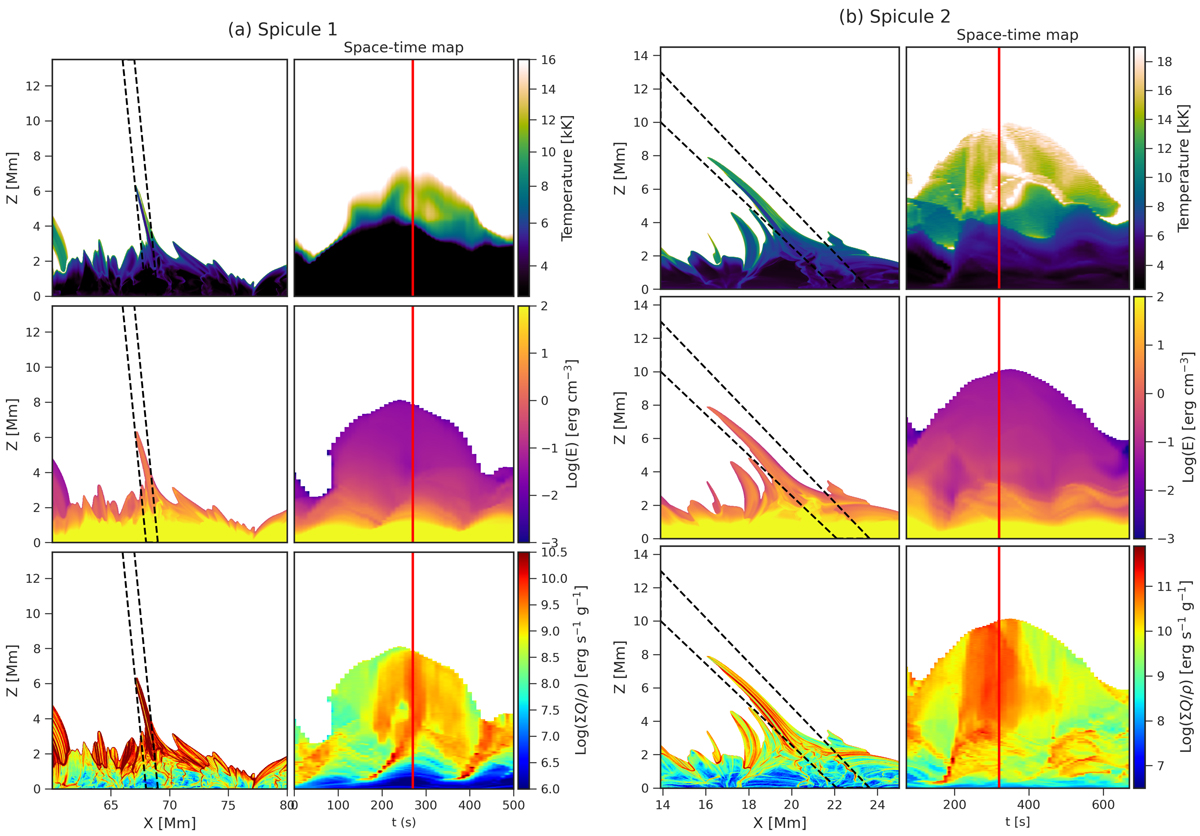
Fig. 8.
Download original image
Spatio-temporal evolution of the different thermodynamic parameters obtained from the MHD simulation. The left column of panel a shows the 2D maps of temperature, internal energy, and the sum over heating parameters (as described in the text) per particle (ρ being the plasma density), and the right column indicates the space-time maps corresponding to each of the physical quantities for spicule 1. The two columns of panel b shows the spatio-temporal evolution corresponding to the same physical quantities for spicule 2, in the same format as panel a. The dashed lines in the left column of the two panels show the bounding regions that are considered for extracting the X − t maps (shown in the respective right columns), and the vertical red line in the X − t maps corresponds to the time steps at which these maps have been shown. Animations of this figure are available online.
Current usage metrics show cumulative count of Article Views (full-text article views including HTML views, PDF and ePub downloads, according to the available data) and Abstracts Views on Vision4Press platform.
Data correspond to usage on the plateform after 2015. The current usage metrics is available 48-96 hours after online publication and is updated daily on week days.
Initial download of the metrics may take a while.