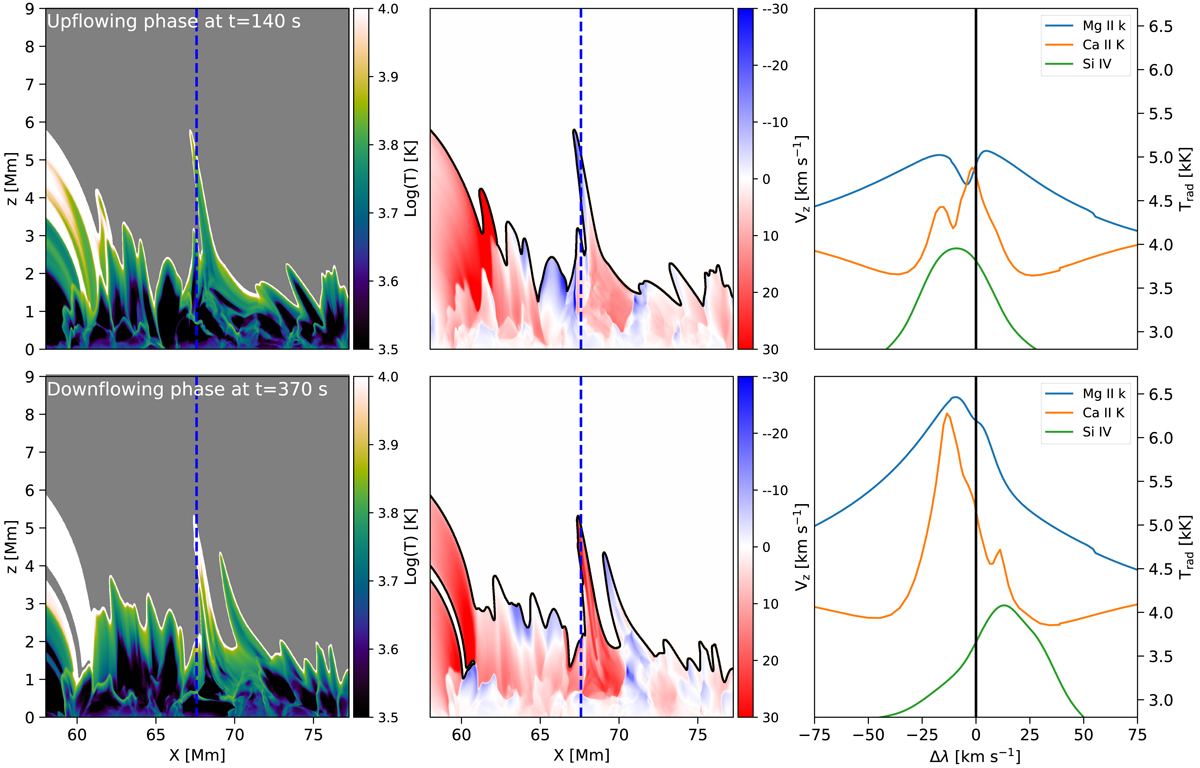
Fig. 7.
Download original image
Synthetic observables of the chromospheric and transition region spectral lines obtained from the numerical simulation. Top row (left to right): a cutout of the 2D temperature map, the signed vertical velocity around spicule 1, and the Ca II K, Mg II k, and Si IV 1393 Å synthetic spectra corresponding to the upflowing phase of the spicule at t = 140 s. Bottom row: corresponding temperature, vertical velocity, and synthetic spectra for the downflowing phase of the spicule at t = 370 s in the same format as the top row. Temperatures beyond 30 kK have been masked in the 2D temperature maps and are indicated with a black contour in the vertical velocity maps. The dashed vertical blue line corresponds to the LOS of the observer along which optically thick (thin) radiative transfer is performed.
Current usage metrics show cumulative count of Article Views (full-text article views including HTML views, PDF and ePub downloads, according to the available data) and Abstracts Views on Vision4Press platform.
Data correspond to usage on the plateform after 2015. The current usage metrics is available 48-96 hours after online publication and is updated daily on week days.
Initial download of the metrics may take a while.