Fig. 4.
Download original image
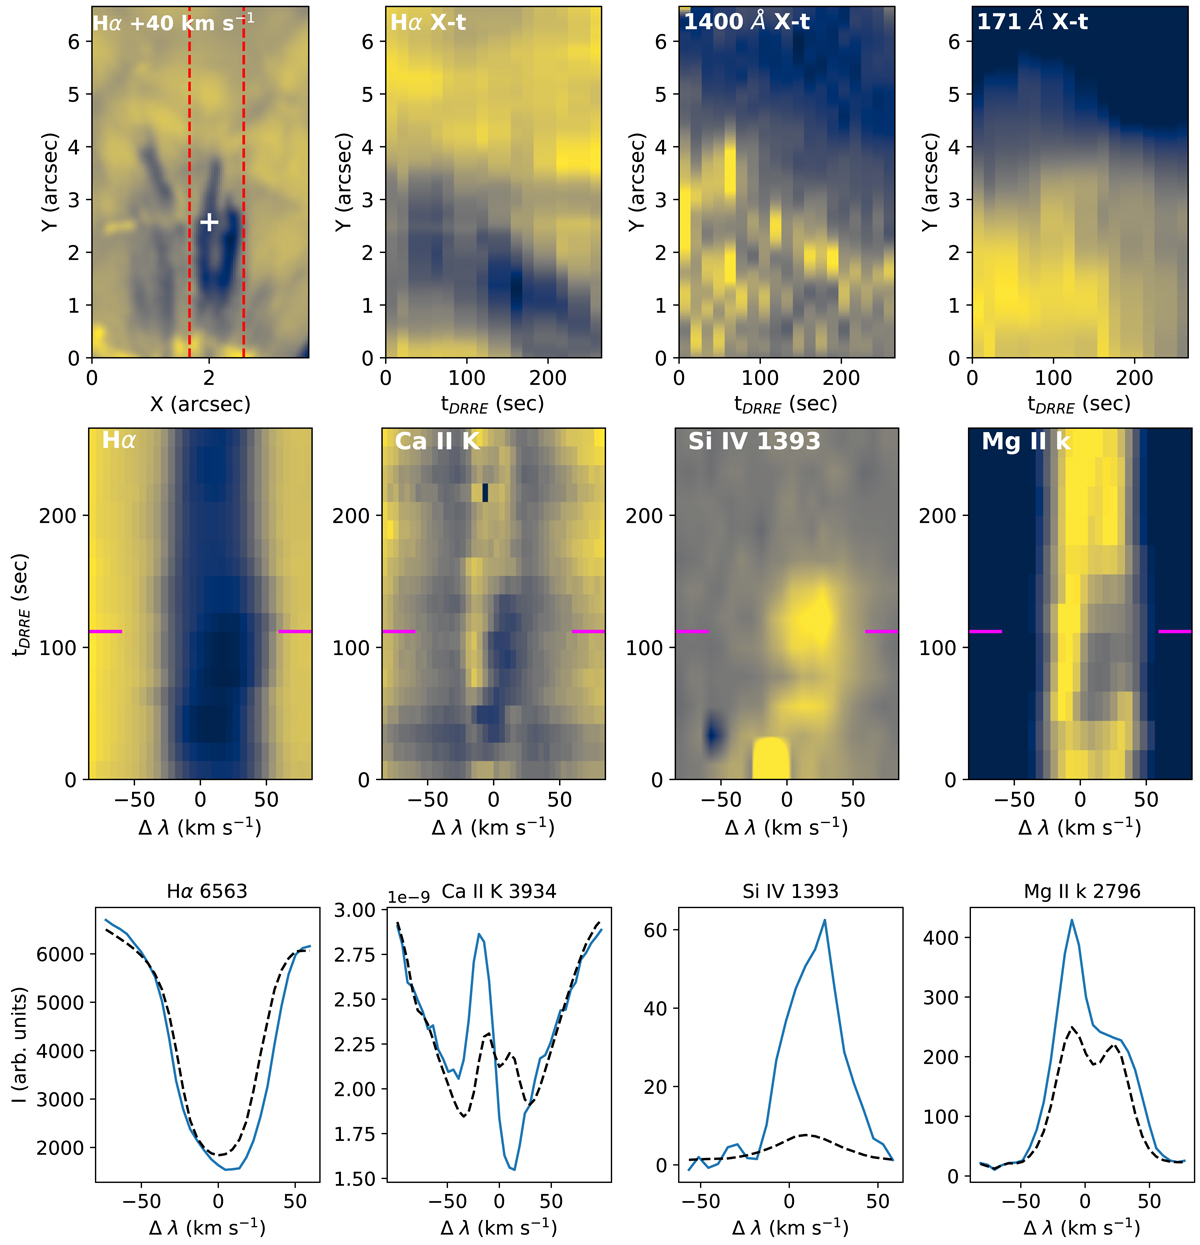
Representative example of a downflowing RRE observed in the SST, IRIS, and SDO data sets acquired on 25 May 2017 and its spectral signature across the different chromospheric and transition region spectral lines. Top row (left to right): Hα red wing image showing the downflowing RRE at +40 km s−1, X − t maps (extracted from the region bounded by the two dashed red lines) corresponding to the Hα red wing at +40 km s−1, the IRIS Si IV 1400 Å SJI, and the AIA 171 Å channels. Middle row (from left to right): λt diagrams in Hα, Ca II K, Si IV 1393 Å, and Mg II k, respectively, corresponding to the spatial location marked with a white cross in the Hα red wing image. Bottom row: corresponding spectral profiles for the different wavelengths at the instant of maximum redward excursion (magenta marker) indicated in the λt diagrams. The dashed spectral profiles correspond to the spatial and temporal average over the whole time series in each case. The observed intensity is shown in arbitrary units.
Current usage metrics show cumulative count of Article Views (full-text article views including HTML views, PDF and ePub downloads, according to the available data) and Abstracts Views on Vision4Press platform.
Data correspond to usage on the plateform after 2015. The current usage metrics is available 48-96 hours after online publication and is updated daily on week days.
Initial download of the metrics may take a while.