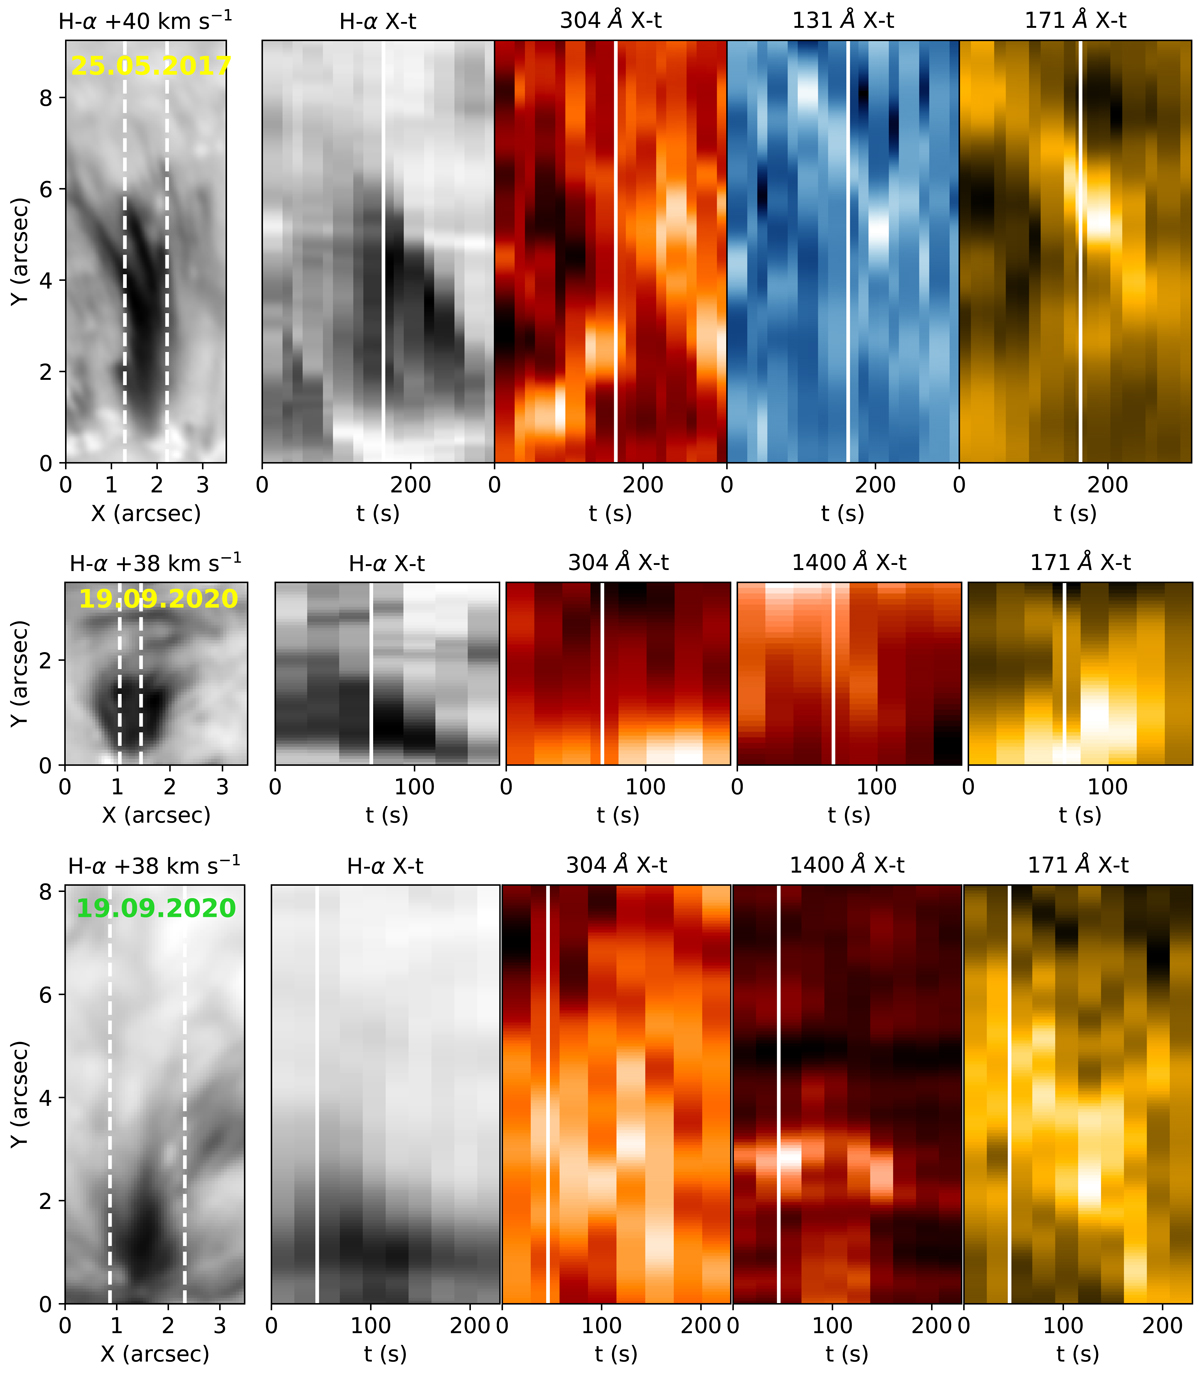
Fig. 3.
Download original image
Space-time (X − t) diagrams for three representative downflowing RREs, on 25 May 2017 (top row) and 19 September 2020 (middle and bottom rows), showing their multi-thermal nature across multiple wavelength channels. The dashed vertical lines in the Hα red wing images indicate the region along which the X − t maps have been extracted in the coordinated SST, IRIS, and SDO data sets. The different panels in each row corresponds to the X − t maps in the different wavelength channels as indicated at the top. The solid white vertical lines in the X − t maps correspond to the time step at which these maps have been shown. Animations of this figure are available online.
Current usage metrics show cumulative count of Article Views (full-text article views including HTML views, PDF and ePub downloads, according to the available data) and Abstracts Views on Vision4Press platform.
Data correspond to usage on the plateform after 2015. The current usage metrics is available 48-96 hours after online publication and is updated daily on week days.
Initial download of the metrics may take a while.