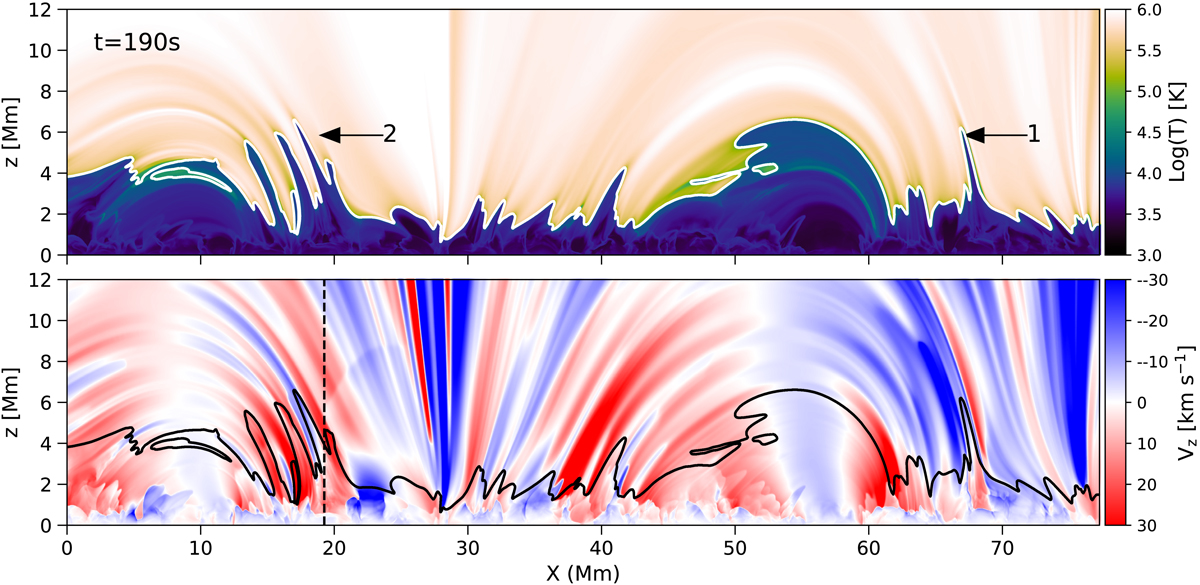
Fig. 2.
Download original image
Overview of the MHD simulation snapshot from Martínez-Sykora et al. (2017b) showing a 2D slice of temperature (top row) and signed vertical velocity vz (bottom row) at t = 190 s from the start. The spicules appear as cool finger-like intrusions in the hot corona, and the ones that are further analyzed are numbered 1 and 2. Velocities away from the observer are indicated in red (positive) and toward the observer in blue (negative). The contour indicates the location where the temperature equals 30 kK. The region to left of the dashed vertical line in the bottom row indicates the region of interest that is further studied in Sect. 5.3. An animation of this figure is available online.
Current usage metrics show cumulative count of Article Views (full-text article views including HTML views, PDF and ePub downloads, according to the available data) and Abstracts Views on Vision4Press platform.
Data correspond to usage on the plateform after 2015. The current usage metrics is available 48-96 hours after online publication and is updated daily on week days.
Initial download of the metrics may take a while.