Fig. 10.
Download original image
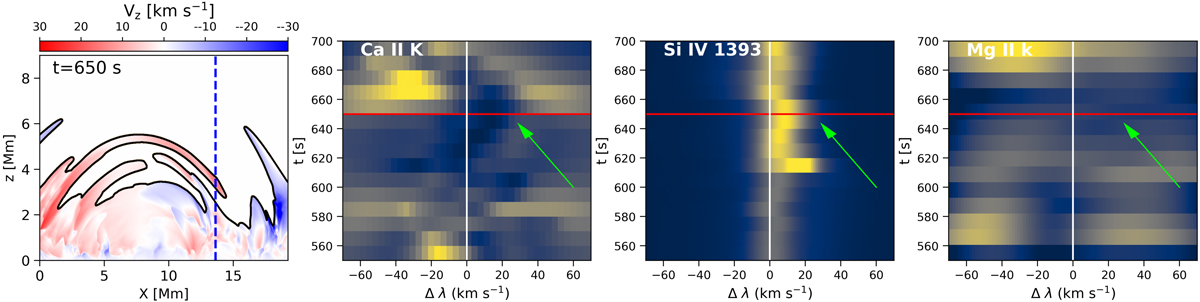
Scenario outlining an alternative mechanism of observing downflowing RREs along a loop-like structure from a simulation perspective. Panels from left to right: a cutout of the 2D vertical velocity (vz) map focusing on the downflowing RRE formed along the loop; and λt diagrams in Ca II K, Si IV 1393 Å, and Mg II k, respectively, corresponding to the location marked with a blue dashed vertical line in the vz map (leftmost panel). The vz map corresponds to the region of interest shown in the bottom row of Fig. 2 at t = 650 s. Each of the λt diagrams show the location of Doppler shift Δλ = 0 (indicated with a white solid line), the time step (red horizontal line), and an arrow pointing at the time interval corresponding to the maximum redward excursions of the respective line centers during the evolution of the downflowing RRE. An animation of this figure is available online.
Current usage metrics show cumulative count of Article Views (full-text article views including HTML views, PDF and ePub downloads, according to the available data) and Abstracts Views on Vision4Press platform.
Data correspond to usage on the plateform after 2015. The current usage metrics is available 48-96 hours after online publication and is updated daily on week days.
Initial download of the metrics may take a while.