Fig. 1.
Download original image
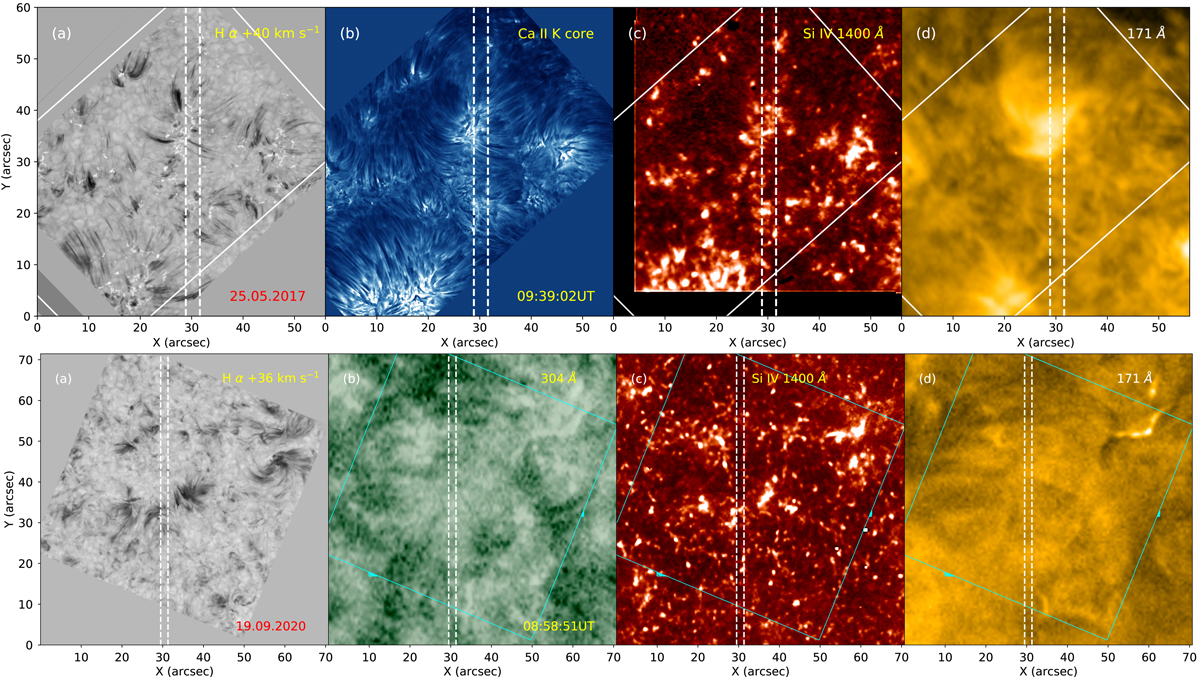
Full FOV of the observations corresponding to data sets 1 (top row) and 2 (bottom row). Top row, panel a: Hα red wing image observed with CRISP at a Doppler offset of +40 km s−1, panel b: corresponding CHROMIS Ca II K line core image, and panels c and d: co-spatial Si IV 1400 Å SJI from IRIS and the 171 Å image from AIA, respectively. Bottom row, panel a: Hα red wing image observed at a Doppler offset of +36 km s−1 acquired with CRISP, and panels b–d: corresponding co-spatial cutouts from AIA 304 Å, the IRIS Si IV 1400 Å SJI, and AIA 171 Å, respectively. The dashed vertical lines correspond to the spatial extent of the IRIS rasters in the two data sets, and the direction to solar north is pointing upward. The white and cyan boxes in the top and bottom rows represent the area of the Ca II K core and the Hα red wing images, respectively. Animations corresponding to these figures are available online.
Current usage metrics show cumulative count of Article Views (full-text article views including HTML views, PDF and ePub downloads, according to the available data) and Abstracts Views on Vision4Press platform.
Data correspond to usage on the plateform after 2015. The current usage metrics is available 48-96 hours after online publication and is updated daily on week days.
Initial download of the metrics may take a while.