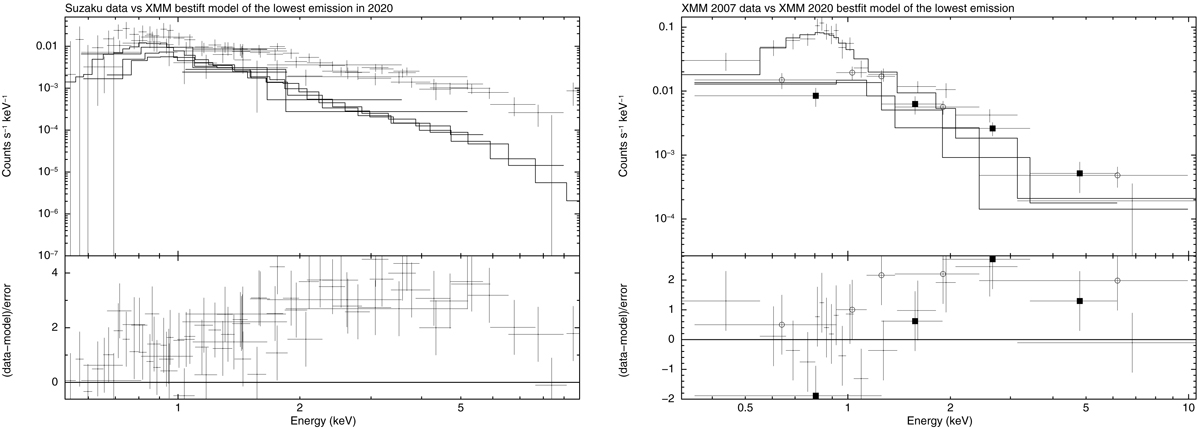
Fig. 5.
Download original image
Comparison of Suzaku (on the left) and XMM–Newton observations performed in 2007 (on the right) with the best fit of the lowest luminosity state observed in 2020 with XMM–Newton. Residuals are reported in the lower panels in units of standard deviations. The meaning of the symbols in the right panel is the following: crosses, empty circles, and solid squares mark the EPIC pn, MOS1, and MOS2 spectra, respectively. Clearly, past observations caught IGR J08408-4503 in harder states.
Current usage metrics show cumulative count of Article Views (full-text article views including HTML views, PDF and ePub downloads, according to the available data) and Abstracts Views on Vision4Press platform.
Data correspond to usage on the plateform after 2015. The current usage metrics is available 48-96 hours after online publication and is updated daily on week days.
Initial download of the metrics may take a while.